Sunday, September 29, 2013

Tuesday, September 24, 2013
Tinggal klik, Uang pun Datang. Berbisnis Online
Tinggal klik, Uang pun Datang
September 20 2011 | By lilies

Tak perlu modal besar, tak perlu tempat usaha, Anda bisa punya butik dengan pelanggan yang tak terbatas jarak. Inilah keuntungan yang didapatkan para pemilik toko online. Hanya duduk di depan komputer meja rumah saja, mereka sudah bisa mendulang ratusan ribu bahkan jutaan rupiah tiap harinya.
Siapa pun, dimana pun, dan kapan pun bisnis online bisa dilakukan. Banyak mereka yang bahkan punya pekerjaan office hour melakukan transaksi online di jam bebas tugas seperti di malam hari. Keuntungan yang diraup tentu saja tergantung dari effort atau konsistensi dari si pemilik bisnis online itu.
Kelebihan lain yang ada pada bisnis ini adalah produk yang tak dibatasi varian ataupun jumlahnya. Anda yang hobi membaca sekalipun, bisa menjual buku bacaan anda yang anda rasa perlu untuk disisihkan demi membeli buku baru yang lain. Dengan Kata lain, anda tidak harus membuat produk anda sendiri. Anda bisa membeli grosir (sistem kulak),lalu menjual dengan harga eceran. Nah, lalu bagaimana memulainya?
Berikut Tips dan Trik memulai bisnis online:
1. Tetapkan produk yang anda jual (lebih baik kalau produk yang anda sukai)
2. Buatlah account email terlebih dahulu, baru facebook , blog atau website.
3. Buatlah foto produk semenarik mungkin , karena bisnis ini ditentukan oleh foto produk
4. Buatlah data online shop anda dengan lengkap jangan sampai tidak ada nomor telpon atau email yang bisa dihubungi pembeli.
5. Mulailah mengupload barang-barang anda setiap jangka waktu tertentu yang sudah anda tetapkan.
6. Mulailah untuk mengumpulkan data shipping untuk luar kota atau dalam kota.
7. Yang paling penting, anda harus sempatkan beberapa jam dalam 1 hari untuk membuka facebook atau blog anda.
Ada 5 hal penting dalam bisnis online yang saya beri nama dengan PAKEM!
1. P: Promosi – Promosi sangat penting dalan bisnis online. Mulailah memperkenalkan produk anda pada teman-teman dekat, seperti teman kantor, teman organisasi atau tetangga. Buatlah promosi diskon pada mereka, sehingga mereka akan kembali lagi pada anda.
2. A: Atensi – Bisnis online sangat erat kaitannya dengan Service. Ramah itu mutlak. Jangan menunjukkan anda sedang capek meladeni pertanyaan dari pembeli. Memberikan perhatian yang selayaknya didapat pembeli sangat penting.
3. K: Kepercayaan dan Konsistensi – Dua hal ini sangat berkaitan erat. Konsistensi yang anda tunjukkan akan memperkuat kepercayaan pembeli pada anda. Misal: upload barang2 baru sangat penting untuk membangun kepercayaan pembeli. Ini memberikan kepercayaan akan keberadaan anda. Begitu juga dengan konsisten memberikan pelayanaan yang baik. Ini juga akan membangun kepercayaan mereka. Mutu barang dan sistem pembelian dan pengembalian jika ada barang yang cacat sangat penting untuk anda perhatikan.
4. E: Endorse – Memakai atau membawa dan menggunakan produk sendiri, sangat efektif. Anda bisa menciptakan image tertentu dan promosi yang ingin anda bangun. Online identik dengan non real, tapi ketika anda menunjukkan produk anda, maka akan tercipta kepercayaan yang lebih pada pembeli.
5. M: Mobile – Hal yang terakhir ini sangat penting untuk pemilik bisnis online. Jangan berhenti untuk mobile. Bangunlah jaringan-jaringan baru atau masuk ke dalam komunitas-komunitas yang anda sukai. Dari komunitas ini akan tercipta kepercayaan diri anda dalam berbisnis. Wawasan yang anda punyai akan mempengaruhi strategi-strategi bisnis untuk kemajuan onlineshop anda. Baik itu dalam hal kemampuan menggunakan teknologi atau meningkatkan kemampuan marketing anda. Dan tentu saja akan membuka peluang ekspansi dengan dukungan material dari rekan-rekan anda.
Ingatlah bisnis online tidak langsung membuahkan hasil yang banyak. Jam terbang dan strategi promosi / marketing sangat mempengaruhi keberhasilan bisnis anda. Jika anda bisa melewati 2 tahun pertama, tandanya anda bisa melakukan ekspansi produk anda.
Selamat mencoba dan terus ON-line!
Penulis: Lilies Rolina Irnanto
Pemilik Online Shop: Rumah Liena (www.rumahliena.blogspot.com)
build-access-manage at dayaciptamandiri.com
Sunday, September 22, 2013
Kolaborasi, sebuah kompetisi baru..
MANIFESTO
Kolaborasi, Sebuah Kompetisi Baru
January 11 2013 | By Sigit Kurniawan
 Sumber Ilustrasi: https://blogger.googleusercontent.com/img/b/R29vZ2xl/AVvXsEiwvRlkhl3RS20Gy5ra_0-B2KG4H6nwPTW8237k8BCif_nNw3g5eAFfKrdSfkk7398Gx2lnGd95Z5BBAmkTtQ57e83Pd5fNKCRMGywg6Qcz5sfV2XbP_iaKVSqs6fJE_8EbQuZuhg/s1600/Collaboration.jpg
Era Internet membuka beragam peluang bisnis. Konektivitas antarorang lintas batas membuat peluang-peluang bisnis makin besar. Bisnis saat ini tidak lagi dikuasai oleh pemain-pemain besar yang sudah menggurita. Tapi, dinamika pasar ini juga diramaikan oleh para pemain baru yang berskala lebih kecil. Salah satu cara agar bisnis tetap sustainable di tengah kompetisi yang makin sengit tersebut adalah berkolaborasi.
Kolaborasi ini bisa dilakukan dengan antarpemain lintas kategori untuk saling mendukung dengan produk dan layanan masing-masing atau kolaborasi dengan para kompetitornya. Kolaborasi dengan kompetitor ini populer disebut dengan co-opetition yang merupakan gabungan dari kata "cooperation" dan "competition."
Kebutuhan untuk berkolaborasi ini menandaskan bahwa "kita tidak bisa bermain sendirian" di pasar. Bahkan, merek-merek rakasasa seperti Apple, Samsung, Google, Starbucks, dan sebagainya melakukan aneka bentuk kolaborasi untuk melangsungkan bisnisnya.
Ada satu artikel menarik di Harvard Business Review yang mengupas bagaimana kolaborasi saat ini sudah masuk pada taraf kompetisi. Kolaborasi tidak lagi sebagai strategi bersama untuk membangun kemitraan, tapi strategi berkolaborasi itu sendiri sudah menjadi strategi menghadapi kompetisi. Secara sederhana, hal ini dipahami sebagai kompetisi antarkolaborasi (antar "geng", misalnya). Kolaborasi model inilah yang menjadi pesan dari artikel berjudul "Collaboration is the New Competition" dan ditulis oleh Ben Hecht, President dan CEO Living Cities.
Hecht menawarkan lima langkah dalam membangun kolaborasi yang memiliki pengaruh untuk perubahan sosial. Berikut adalah sadurannya:
1. Mendefinisikan dengan jelas apa yang akan dikerjakan secara bersama.Sejak awal, pebisnis harus bisa merumuskan apa secara jelas apa yang menjadi tujuan utama dari kolaborasi tersebut. Mereka juga harus bisa mengartikulasikannya dalam langkah-langkah konkret. Pertanyaan kritis yang bisa dilontarkan untuk merumuskan tujuan kolaborasi itu adalah "Apa yang bisa dilakukan dengan kolaborasi yang tidak bisa kita lakukan sendirian?" . Hecht memberi contoh sebuah kolaborasi yang melibatkan penentu kebijakan, perusahaan, yayasan, maupun komunitas organisasi.
2. Melihat kolaborasi dengan pandangan lebih luas. Kolaborasi yang baik terjadi bila mampu merangkum dan melihat tujuan secara lebih luas. Untuk bisa ke sana, orang yang dilibatkan pertama untuk merumuskan visi kolaborasi adalah para petinggi perusahaan atau lembaga. Misalnya, mereka yang menjabat sebagai CEO.
3. Beradaptasi pada data. Kolaborasi antarlembaga atau perusahaan yang berbeda tidak lepas dari masalah. Hal ini tak jarang bersifat kompleks. Tantangan ini membutuhkan pembelajaran kontinu dan inovasi serta penggunaan data real time untuk membantu partisipan dalam memahami apa yang bisa dan tidak bisa dilakukan dalam kolaborasi tersebut.
4. Berbagi dalam kolaborasi. Di sini, para kolaborator harus mau berbagi apa yang dimiliki masing-masing, baik informasi, metode, dan sebagainya. Mereka harus bisa bekerjasama, saling belajar, dan mendukung. Kerjasama ini sangat dimudahkan dengan kehadiran internet yang menyediakan kanal-kanal untuk konektivitas.
5. Dukungan tim inti. Kemajuan terbaik bisa dicapai ketika tim inti kolaborasi tersebut tetap menjaga dinamika kolaborasi. Misalnya, selalu memberikan semangat, melibatkan dan mengembangkan tim, dan sebagainya.
Gula Pasir yg galau
Inspirasi hari ini :
Alkisah gula pasir, pemanis alami dari olahan tumbuhan tebu ini sedang galau hatinya.
Gula pasir merasa kalau selama ini dirinya tidak dihargai manusia. Dimanfaatkan, tapi dilupakan begitu saja. Walau ia sudah mengorbankan diri untuk memaniskan teh panas, tapi manusia tidak menyebut-nyebut dirinya dalam campuran teh dan gula itu. Manusia cuma menyebut, "Ini teh manis." Bukan teh gula. Apalagi teh gula pasir.
Begitu pun ketika gula pasir dicampur dengan kopi panas. Tak ada yang mengatakan campuran itu dengan kopi gula pasir. Melainkan, kopi manis. Hal yang sama ia alami ketika dirinya dicampur berbagai adonan kue dan roti. Gula pasir merasa kalau dirinya cuma dibutuhkan, tapi kemudian dilupakan.
Ia cuma disebut manakala manusia butuh. Setelah itu, tak ada penghargaan sedikit pun. Tak ada yang menghargai pengorbanannya, kesetiaannya, dan perannya yang begitu besar sehingga sesuatu menjadi manis.
Sosok gula pasir merupakan pelajaran tersendiri buat mereka yang giat berbuat banyak untuk orang banyak. Sadar atau tidak, kadang ada keinginan untuk diakui, dihargai, bahkan disebut-sebut namanya sebagai yang paling berjasa. Persis seperti yang disuarakan gula pasir.
Dalam kehidupan keseharian kita entah di kantor, di lingkungan rumah, maupun lingkungan profesi sekalipun, seringkali kita mendapati ada orang-orang tertentu seperti gula pasir yang banyak berjasa bagi orang lain tetapi tidak terlihat, tidak mendapatkan apresiasi yang layak, dihargai sumbangsihnya, maupun yang lebih ekstrim adalah dianggap sosok pelangkap semata, bahkan dicibir dan diremehkan.
Tidak perlu galau , apalagi kecewa. Teruslah berbagi kebaikan walau tidak dikenal maupun dihargai. Yang penting semua itu dilakukan dalam ketulusan hati. Pemanis akan tetap dicari dan diingat dalam bentuk yang lain. Tidak ada orang yang bisa mendapatkan "manis" kalau tidak ada gula
Selamat ' Hari Minggu ' ..
build-access-manage at dayaciptamandiri.com
Saturday, September 21, 2013
Solarwinds SAM semakin kuat..
SolarWinds Sets Sights on Database Management Market, Integrates Systems Management With Database Monitoring
AUSTIN, TX -- (Marketwired) -- SolarWinds (NYSE: SWI), a leading provider of powerful and affordable IT management software, announced today its continued commitment to strengthen its award-winning SolarWinds Server & Application Monitor (SAM), one of nine key products in the SolarWinds systems and application management product portfolio.
Designed to deliver agentless performance and availability monitoring, alerting and reporting for over 150 applications and server types, SolarWinds SAM 6.0 will now enable IT professionals to achieve server, application and database monitoring in one complete solution. New features include:
- AppInsight for SQL - AppInsight for SQL provides deep visibility into Microsoft SQL Server performance for systems administrators, database administrators and SQL developers. With AppInsight for SQL, IT pros have instant visibility into database performance issues, such as long-running queries, reducing manual time spent troubleshooting performance issues while improving application uptime.
- Baseline Threshold Calculator - Thresholds can be automatically generated from a baseline of "normal" behavior to reduce the number of alerts that require response and quickly pinpoint systems that are performing out of a normal state. This feature allows IT pros to calculate thresholds from baseline data for 24/7 system performance, establish warning and critical thresholds at 2 and 3 standard deviations from normal performance.
- IT Asset Inventory Dashboard - With automated IT asset inventory management, IT pros can now maintain a view of current hardware and software asset inventory including server warranty status, driver software, hard drive inventory, and custom properties like PO number and purchase price, saving valuable time when tracking virtual and physical asset depreciation and gathering information about the stock of software and hardware assets.
SolarWinds Server & Application Monitor highlights added since version 5.0 in March 2012:
- Resolve server and application issues directly from the product's web console
- Monitor server hardware health indicators for vendors such as HP, Dell, IBM, and VMware
- Troubleshoot problems faster with real-time visibility into service and process performance
- Track storage volume performance metrics
- Integrate with System Center 2012
- Leverage support for Microsoft Hyper-V
Over 10,000 users worldwide have benefited from SolarWinds' comprehensive application and server monitoring solution with more than 550 individual licenses alone issued since SolarWinds SAM 5.0.
Supporting quotes:
"SolarWinds SAM provides great insight into how our servers and databases are performing -- we know when they are busy, if there is abnormal memory condition, or if something is wrong within our infrastructure," said Jim Shank, Infrastructure Support Manager, Douglas County School District. "Now with AppInsight for SQL, we're able to drill down to identify issues with specific database instances, RAM usage, sensitive queries, and so on. We can be proactive, find sloppy and slow procedures, identify the problem and fix it. It's been huge for us."
"I manage a high volume of customer databases that can take anywhere from 12 to 24 hours to run traces on just to see how a server was performing over time and to understand top CPU-intensive queries. Now with SolarWinds SAM's AppInsight for SQL, it will take a matter of five minutes to do," said Thomas Löfstrand, IT Consultant and Senior Partner, Nethouse. "SolarWinds SAM is a complete platform to run an entire IT server environment -- you get monitoring, asset management and now specialized SQL server monitoring. You get everything with SolarWinds; there's no need for specialized tools."
"With the enormity and complexity of data requests and queries, it is increasingly difficult and time consuming to troubleshoot database issues," said Denny LeCompte, SVP of product strategy, SolarWinds. "SolarWinds SAM 6.0 delivers on both expanded depth of coverage and quality of information collected to provide a best-of-breed, integrated systems and database management platform for IT pros with responsibility for application health and databases."
Additional Resources:
- Video: Server Monitoring Software: Introduction to Server & Application Monitor
- Video: SQL Server Performance: AppInsight for SQL
- Customer interview: Douglas County School District
- Customer interview: Nethouse
Pricing and Availability
SolarWinds Server & Application Monitor starts at $2,995 and includes a year of maintenance. For more information, including a downloadable,free 30-day evaluation trial, visit the SolarWinds website or call866.530.8100.
About SolarWinds
SolarWinds (NYSE: SWI) provides powerful and affordable IT management software to customers worldwide from Fortune 500 enterprises to small businesses. In all of our market areas, our approach is consistent. We focus exclusively on IT Pros and strive to eliminate the complexity that they have been forced to accept from traditional enterprise software vendors. SolarWinds delivers on this commitment with unexpected simplicity through products that are easy to find, buy, use and maintain while providing the power to address any IT management problem on any scale. Our solutions are rooted in our deep connection to our user base, which interacts in our online community, thwack, to solve problems, share technology and best practices, and directly participate in our product development process. Learn more today at http://www.solarwinds.com/.
White Paper: Reference Architecture: GlassHouse, Citrix XenDesktop, Microsoft Hyper-V and Atlantis ILIO Diskless VDI
Article Tags
Thursday, September 19, 2013
Apakah semua BUMN sudah memanfaatkan IT ?
Apakah semua BUMN sudah memanfaatkan IT ?
| BUMN Didesak Memanfaatkan TI |  |  |  |
| Tuesday, 02 July 2013 12:46 |

(Kompas) Jakarta, Kompas-Kementerian Badan Usaha Milik Negara mendesak agar seluruh BUMN meningkatkan implementasi teknologi informasi dalam rangka peningkatan daya saing dan transformasi bisnis BUMN. Beberapa BUMN yang telah memanfaatkan teknologi informasi dalam bisnisnya terbukti mendatangkan keuntungan yang sangat besar.
”Teknologi informasi (IT) dapat memfasilitasi perubahan kearah yang lebih baik. Namun teknologi informasi tidak dapat menciptakan perubahan sendiri. Harus ada dukungan dan komitmen pimpinan perusahaan, yakni dewan komisaris, dewan pengawas, dan direksi,” kata Mahmuddin Yasin, Wakil Menteri BUMN saat membuka Pertemuan Bisnis Eksekutif Kementerian BUMN dan BUMN, di Jakarta, Senin (1/7). Pimpinan perusahaan ini, ditambahkan Yasin, memegang peranan penting untuk memulai inisiatif perubahan, mulai dari pembuatan kebijakan, keputusan investasi IT, hingga pengawasan dalam implementasi dan pengelolaan IT. ”Diharapkan dengan penerapan yang baik, maka target level kematangan dari tata kelola IT BUMN dalam lima tahun ke depan mencapai level 3, sesuai dengan level kematangan yang ditetapkan,” ujar Yasin. Sementara itu, Ignasius Jonan, Direktur Utama PT Kereta Api Indonesia, mengatakan, penerapan IT di jajaran kereta api berhasil menghapuskan praktik calo dalam pembelian tiket kereta api. ”Segala upaya sudah dilakukan, dari meminta bantuan aparat keamanan, baik polisi maupun TNI, tetapi tidak berhasil. Karyawan saya yang semuanya beragama, ternyata juga belum berhasil menghapuskan praktik calo tiket. Setelah dengan IT, calo hilang semua,” kata Jonan. Sementara, Sofyan Basir, Direktur Utama Bank Rakyat Indonesia, mengatakan, fasilitas IT telah membuat perusahaannya bisa melayani masyarakat hingga ke pelosok pedesaan. ”Kredit juga bisa disalurkan hingga ke desa-desa. Pengiriman uang juga bisa dilakukan seketika. Dengan demikian, terjadi pertumbuhan di daerah-daerah pelosok,” kata Sofyan. Direktur Utama PT Semen Indonesia Dwi Soetjipto melakukan konferensi video untuk meresmikan ERP Go Live di Than Long Cement Company (TLCC) di Vietnam. ”Dengan penerapan enterprise resource planning (ERP) ini, maka pengelolaan operasional dan keuangan TLCC akan terintegrasi dengan sistem IT Semen Indonesia. Dengan demikian, sebagai induk, Semen Indonesia akan dengan mudah melakukan monitoring dan kontrol terhadap tata kelola di anak perusahaan,” kata Dwi. |
Kecil itu Besar ..
Small is the new big
Big used to matter. Big meant economies of scale. (You never hear about “economies of tiny” do you?) People, usually guys, often ex-Marines, wanted to be CEO of a big company. The Fortune 500 is where people went to make… a fortune.
There was a good reason for this. Value was added in ways that big organizations were good at. Value was added with efficient manufacturing, widespread distribution and very large R&D staffs. Value came from hundreds of operators standing by and from nine-figure TV ad budgets. Value came from a huge sales force.
Of course, it’s not just big organizations that added value. Big planes were better than small ones, because they were faster and more efficient. Big buildings were better than small ones because they facilitated communications and used downtown land quite efficiently. Bigger computers could handle more simultaneous users, as well.
Get Big Fast was the motto for startups, because big companies can go public and get more access to capital and use that capital to get even bigger. Big accounting firms were the place to go to get audited if you were a big company, because a big accounting firm could be trusted. Big law firms were the place to find the right lawyer, because big law firms were a one-stop shop.
And then small happened.
Enron (big) got audited by Andersen (big) and failed (big.) The World Trade Center was a target. TV advertising is collapsing so fast you can hear it. American Airlines (big) is getting creamed by Jet Blue (think small). BoingBoing (four people) has a readership growing a hundred times faster than the New Yorker (hundreds of people).
Big computers are silly. They use lots of power and are not nearly as efficient as properly networked Dell boxes (at least that’s the way it works at Yahoo and Google). Big boom boxes are replaced by tiny ipod shuffles. (Yeah, I know big-screen tvs are the big thing. Can’t be right all the time).
I’m writing this on a laptop at a skateboard park… that added wifi for parents. Because they wanted to. It took them a few minutes and $50. No big meetings, corporate policies or feasibility studies. They just did it.
Today, little companies often make more money than big companies. Little churches grow faster than worldwide ones. Little jets are way faster (door to door) than big ones.
Today, Craigslist (18 employees) is the fourth most visited site according to some measures. They are partly owned by eBay (more than 4,000 employees) which hopes to stay in the same league, traffic-wise. They’re certainly not growing nearly as fast.
Small means the founder makes a far greater percentage of the customer interactions. Small means the founder is close to the decisions that matter and can make them, quickly.
Small is the new big because small gives you the flexibility to change the business model when your competition changes theirs.
Small means you can tell the truth on your blog.
Small means that you can answer email from your customers.
Small means that you will outsource the boring, low-impact stuff like manufacturing and shipping and billing and packing to others, while you keep the power because you invent the remarkable and tell stories to people who want to hear them.
A small law firm or accounting firm or ad agency is succeeding because they’re good, not because they’re big. So smart small companies are happy to hire them.
A small restaurant has an owner who greets you by name.
A small venture fund doesn’t have to fund big bad ideas in order to get capital doing work. They can make small investments in tiny companies with good (big) ideas.
A small church has a minister with the time to visit you in the hospital when you’re sick.
Is it better to be the head of Craigslist or the head of UPS?
Small is the new big only when the person running the small thinks big.
Don’t wait. Get small. Think big.
Sunday, September 15, 2013
Mail Flow dalam Exchange 2013
Mail Flow

Applies to: Exchange Server 2013
Topic Last Modified: 2013-03-28
In Microsoft Exchange Server 2013, mail flow occurs through the transport pipeline. The transport pipeline is a collection of services, connections, components, and queues that work together to route all messages to the categorizer in the Transport service on a Mailbox server inside the organization.
Looking for a list of all mail flow topics? See Mail flow documentation.
For information about how to configure mail flow in a new Exchange 2013 organization, see Configure Mail Flow and Client Access.
Contents
The transport pipeline consists of the following services:
- Front End Transport service This service runs on all Client Access servers and acts as a stateless proxy for all inbound and outbound external SMTP traffic for the Exchange 2013 organization. The Front End Transport service doesn't inspect message content, only communicates with the Transport service on a Mailbox server, and doesn't queue any messages locally.
- Transport service This service runs on all Mailbox servers and is virtually identical to the Hub Transport server role in previous versions of Exchange. The Transport service handles all SMTP mail flow for the organization, performs message categorization, and performs message content inspection. Unlike previous versions of Exchange, the Transport service never communicates directly with mailbox databases. That task is now handled by the Mailbox Transport service. The Transport service routes messages between the Mailbox Transport service, the Transport service, and the Front End Transport service.
- Mailbox Transport service This service runs on all Mailbox servers and consists of two separate services: the Mailbox Transport Submission service and Mailbox Transport Delivery service. The Mailbox Transport Delivery service receives SMTP messages from the Transport service on the local Mailbox server or on other Mailbox servers, and connects to the local mailbox database using an Exchange remote procedure call (RPC) to deliver the message. The Mailbox Transport Submission service connects to the local mailbox database using RPC to retrieve messages, and submits the messages over SMTP to the Transport service on the local Mailbox server, or on other Mailbox servers. The Mailbox Transport Submission service has access to the same routing topology information as the Transport service. Like the Front End Transport service, the Mailbox Transport service also doesn't queue any messages locally.
Messages from outside the organization enter the transport pipeline through a Receive connector in the Front End Transport service on a Client Access server and are then routed to the Transport service on a Mailbox server.
Messages inside the organization enter the Transport service on a Mailbox server in one of the following ways:
- Through a Receive connector.
- From the Pickup directory or the Replay directory.
- From the Mailbox Transport service.
- Through agent submission.
 Note: Note: |
|---|
| If you have an Exchange 2010 or Exchange 2007 Edge Transport server in your perimeter network, Internet mail flow occurs directly between the Transport service on the Mailbox server and the Edge Transport server. For more information, see Use an Edge Transport Server in Exchange 2013. |
The following figure shows the relationships among the components in the Exchange 2013 transport pipeline.

Every message that's sent or received in an Exchange 2013 organization must be categorized in the Transport service on a Mailbox server before it can be routed and delivered. After a message has been categorized, it's put in a delivery queue for delivery to the destination mailbox database, the destination database availability group (DAG), Active Directory site, or Active Directory forest, or to the destination domain outside the organization.
The Transport service on a Mailbox server consists of the following components and processes:
- SMTP Receive When messages are received by the Transport service, message content inspection is performed, transport rules are applied, and anti-spam and anti-malware inspection is performed if they are enabled. The SMTP session has a series of events that work together in a specific order to validate the contents of a message before it's accepted. After a message has passed completely through SMTP Receive and isn't rejected by receive events, or by an anti-spam and anti-malware agent, it's put in the Submission queue.
- Submission Submission is the process of putting messages into the Submission queue. The categorizer picks up one message at a time for categorization. Submission happens in three ways:
- Through an SMTP Receive connector.
- Through the Pickup directory or the Replay directory. These directories exist on the Mailbox server. Correctly formatted message files that are copied into the Pickup directory or the Replay directory are put directly into the Submission queue.
- Through a transport agent.
- Categorizer The categorizer picks up one message at a time from the Submission queue. The categorizer completes the following steps:
- Recipient resolution, which includes top-level addressing, expansion, and bifurcation.
- Routing resolution.
- Content conversion.
- SMTP Send How messages are routed from the Transport service depends on the location of the message recipients relative to the Mailbox server where categorization occurred. The message could be routed to the Mailbox Transport service on the same Mailbox server, the Mailbox Transport service on a different Mailbox server that's part of the same DAG, the Transport service on a Mailbox server in a different DAG, Active Directory site, or Active Directory forest, or to the Front End Transport service on a Client Access server for delivery to the Internet.
The following table contains links to topics that will help you learn about and manage mail flow in Exchange 2013.
| Topic | Description |
|---|---|
Mail routing describes how messages are transmitted between messaging servers.
| |
Connectors define where and how messages are transmitted to and from Exchange servers.
| |
Accepted domains define the SMTP address spaces that are used in the Exchange organization. Remote domains configure message formatting and encoding settings for messages sent to external domains.
| |
Transport agents act on messages as they travel through the Exchange transport pipeline.
| |
Transport high availability describes how Exchange 2013 keeps redundant copies of messages during transit and after delivery.
| |
Transport logs record what happens to messages as they flow through the transport pipeline.
| |
Moderated transport requires approval for messages sent to specific recipients.
| |
Content conversion controls the Transport Neutral encoding format (TNEF) message conversion options for external recipients, and the MAPI conversion options for internal recipients.
| |
Delivery status notifications (DSNs) are the system messages that are sent to message senders, for example, non-delivery reports (NDRs).
| |
Delivery Reports is a message tracking tool that you can use to search for delivery status on email messages sent to or from users in your organization's address book, with a certain subject. You can track delivery information about messages sent by or received from any specific mailbox in your organization.
| |
This topic describes the size and individual component limits that are imposed on messages.
| |
You use the Queue Viewer in the Exchange Toolbox to view and act upon queues and message in queues.
| |
The pickup and replay directories are used to insert message files into the transport pipeline.
| |
This topic describes the considerations for using an Edge Transport server from previous versions of Exchange in Exchange 2013.
|
Logging dgn Logstash, ElasticSearch, Kibana dan Redis
Logging with Logstash, ElasticSearch, Kibana and Redis
From a vagrant image to a working application
Introduction
As a fan of metrics and of acquiring as much useful information as possible my go-to tool is Statsd and Graphite but when I need to drill down for more information either to provide business information or just to track down a bug I need to get quick access to all the logs related with a specific query. I need these logs to be parsed, centralised, filtered and ready to go.
This tutorial explains how to get from a bare bones Vagrant image into something useful. Ideally I would do this through proper automated provisioning with Chef, Puppet or CFEngine but as a learning experience and a way to play around with configuration I’ll go through the steps one by one.
Vagrant
Vagrant is a quick way to make a portable separate environment in which to test new tools and applications — I used the Ubuntu Precise 32bit image to make this example.
vagrant init precise http://files.vagrantup.com/precise32.box
The only configuration requirements for your Vagrantfile needed to complete this are:
config.vm.forward_port 80, 8080 #for Kibana3
config.vm.forward_port 5601, 5601 #for Kibana2, if you prefer
config.vm.forward_port 9200, 9200 #for ElasticSearch Master
After that just run and SSH into the new image
vagrant up
vagrant ssh
I’d also suggest adding a few tools
sudo apt-get update
sudo apt-get install vim zip
Kibana 2 — you can skip this and go to Kibana 3
Once you’re in you can get a copy of Kibana 2 and install it as well as all tools required for it.
sudo apt-get install build-essential g++
wget https://github.com/rashidkpc/Kibana/archive/v0.2.0.zip
unzip v0.2.0.zip
cd Kibana-0.2.0
sudo gem install bundler
bundle install
The only configuration you’ll need at KibanaConfig.rb is to change the address Kibana listens on so it works with the port forwarding.
KibanaHost = ‘0.0.0.0'
You can run Kibana as any other ruby application. It will use the default port 5601 which is already forwarded.
ruby kibana.rb
Kibana 3
Kibana 3 only needs a web server to run so the quick and dirty (don’t do this even near Production!) way to get it up would be to install one and change the default website to show it.
sudo apt-get install nginx
wget https://github.com/elasticsearch/kibana/archive/master.zip
unzip master.zip
sudo cp -R ~/kibana-master /usr/share/nginx/kibana-master
On /etc/nginx/sites/available/default just move the default website root to Kibana
root /usr/share/nginx/kibana-master;
And reload the web server to apply the changes.
sudo service nginx restart
I’m assuming that either Kibana installation is looking into the default ElasticSearch port 9200.

Elastic Search
Elastic Search will allow to query all the data from the logs, you’ll need to install Java.
sudo apt-get install openjdk-7-jre-headless
As well as change the cluster name on config/elasticsearch.yml in if you have other people testing it in the same network as it comes with auto-discovery on — this will allow you to start several instances of ES simultaneously to practice different combinations of number of indexes, shards, replicas and more.
cluster.name: goncalo-elasticsearch
To manually start one instance (or a new one) just use:
./bin/elasticsearch -f
This instance will automatically set itself on the default port and as a Master node.
A helpful plugin for ES is Head which will give you a graphical interface to add, change and delete indexes, browse data and more.
You can add it to your local development environment as your vagrant image will be forwarding the ES port.
git clone git://github.com/mobz/elasticsearch-head.git
cd elasticsearch-head
open index.html

The default set up will provide indexes with five shards and one replica.In the screenshot above I have two nodes (Blue Streak and Wizard), two indexes (logstash-2013.07.03 and logstash-2013.08.06) and each shard has one replica.
All master copies of each shard are in Blue Streak with the bold line.
Logstash
Logstash will give you a way to read, parse logs as well as push them into ES. Just get a new copy of Logstash and create a configuration file for it.
mkdir logstash
cd logstash
wget https://logstash.objects.dreamhost.com/release/logstash-1.1.13-flatjar.jar
Given a folder with logs being shipped from a CDN we can create an input filter in a new custom configuration file i.e. log.conf. More information can be seen in the Logstash tutorial
file { path => “/home/vagrant/logstash/*.log” type => “cdn” }
As well as several filters. Grok will apply a pattern to split all the fields, There is a good list of Grok patterns here and an online tool to test patterns here.
grok { type => “cdn” pattern => “%{IPORHOST:message_ip} % {IPORHOST:message_hostname} — %{HTTPDATE:message_date} \”%{WORD:message_httpmethod} %{URI:message_uri} HTTP/%{NUMBER:message_httpversion}\” %{NUMBER:message_responsecode}” }
KV will split the URL query string parameters into new fields, this will be useful for filtering logs.
kv { field_split => “&?” }
Mutate will change current fields in the pipeline, I’m using it here to remove the original unparsed message as well as other information generated by the input filter.
mutate { remove => [ “@message” ] remove => [ “@source” ] remove => [ “@source_path” ] remove => [ “@source_host” ] }
Date will parse and assign the log timestamp with the one from the CDN. By default this is the timestamp of the ingestion through the input filter.
date { match => [ “message_date”, “dd/MMM/YYYY:HH:mm:ss Z” ] }
As an ouput filter we’ll add a stdout so we can visualise what is being ingested. As well as the elasticsearch_http filter (I use this instead of the default ES one as it is version independent).
stdout { debug => true debug_format => “json”}
By default the flush_size will be 100 and the index name will generate per timestamp by as logstash-[current date]
elasticsearch_http { host => “localhost” port => “9200" }
A working copy of this filter (for my own logs) will be here
You should now be able to add or append new logging rows which will be ingested. You’ll be able to query the data on both the ES Head and on either of the Kibana interfaces.
There is a very good read about optimising index sizes and more here in the Logstash Github account.
Redis
There are a few reasons to add Redis, RabbitMQ or another way to queue entries. You’ll want to split the filtering from the ingestion in a centralised manner, add several Logstash shippers or just have a way to buffer new logs from any type of slower parsing.
There is some more information about how to do this in the Logstash advanced tutorial and in the Kibana advanced tutorial.
sudo apt-get install redis-server
Now you can split the original log.conf into two files depending if they’re reading into Redis or grabbing from the queue, parsing and sending to ES.
Depending if it’s the input file (example here) or the output file (example here) you’ll add the Redis filter in the correct place.
redis { host => “localhost” type => “cdn” data_type => “list” key => logstash” }
Now you just need to use Logstash for each config file or even add them to the same folder and run Logstash with both at the same time.
java -jar logstash-1.1.13-flatjar.jar agent -f redisconf/
You can now verify with any query that the data is still being received by ES and query the Redis CLI to check current queue length.

Conclusion
This group of tools work out of the box, I felt this was a good exercise to try out the latest versions of each and to have a better understanding to write configuration and automation when required.
After being through the individual tutorials I felt it lacked a unified tutorial that went through the problems I faced while going on each step.
Setting up these tools is only half the battle. The system needs to be configured and set-up in a way that the logs are filtered in a useful way as well as prepare all of these for the most performant/resilient combination possible.
Message tracking tools dlm Exchange Server 2010 dgn EMS
Exchange Management Shell, Queue Viewer: Message tracking tools
Solution providers' takeaway: Monitoring the health of Exchange Server 2010 requires you to know how to use Exchange Management Shell and Queue Viewer to track messages and determine if there are mail flow issues in the server.


When your Exchange servers are healthy and performing well, there is a much smaller chance of problems surfacing that you didn't anticipate. This chapter is about being proactive. That is, actively seeking out potential issues before they happen. In order to be proactive, we'll look primarily in two areas. The first area is ensuring that your Exchange servers are healthy. I'll show you how to make sure that mail is flowing freely throughout your transport servers. I'll also show you how to proactively verify your health by monitoring your logs and other factors. We'll also take a look at the Exchange Best Practices Analyzer, and use that helpful tool to make sure that your Exchange implementation is in line with best practices.
The second area that we'll look at is the performance of Exchange. There are many methods and tools that can be used to evaluate the performance of your Exchange servers. I'll show you how to use the most common tools and methods that you'll want to use in your environment as a minimum.
Keep Exchange Healthy
The Exchange administrator has no bigger task than to ensure that the system stays up and running. Unfortunately, many administrators are forced to live in reactive mode, constantly putting out the biggest fire. Instead, administrators should strive to be consistently in proactive mode. When you are in a state of proactivity, you don't need to "react" to events, but instead you "respond" to them. In other words, living in proactive mode means that you'll smell the smoke before the fire starts. You'll detect little issues and quirks ahead of time so you can correct them before they become big problems.
There are a few key areas that you need to become proactive in if you want to be effective in keeping your Exchange implementation healthy:
- Keeping messages moving in and out of the Exchange Organization
- Ensuring that your Exchange servers aren't standing on their last leg
- Using best practices in your implementation
This section shows you what you can do to proactively monitor the health of Exchange in these areas.
Ensure That Mail Flows Freely
Ensuring that mail can be routed successfully throughout your environment is an important area to look at when you are monitoring Exchange health. A routing problem may not be easy to detect until it has compounded for a while. This is one of those areas where you can't depend on your users to notify you if there's a problem. If mail delivery is delayed, users may not even call the help desk because they may just blame it on the "slow network." And when messages are routed outside the organization, there are so many factors outside your control that you may not even realize the problem is with your servers.
Now more than ever, it's important to pay careful attention to your routing topology because Exchange relies heavily on an external dependency—Active Directory. Exchange administrators may not be aware of site topology changes in Active Directory (AD), and this can greatly affect how mail is routed.
Check Message Queues
When messages can't be routed to the next hop toward their destination, they will be held in one of the queues on the transport server that can't route the message. If users are sending mail and the messages are taking a long time to reach their recipients, there may be an excessive amount of messages in a queue. Therefore, it's important to monitor your queues and ensure that no issues exist that might prevent message delivery.
The two primary tools for checking message queues in Exchange Server 2010 are the Queue Viewer and the Exchange Management Shell (EMS). The Queue Viewer is accessible through the Toolbox portion of the Exchange Management Console (EMC). To open the Queue Viewer, follow these steps:
- Open the EMC and browse to the Toolbox node in the Console tree. The Work area will list several tools that are included in Exchange Server 2010.
- In the Mail Flow Tools section, double-click the Queue Viewer tool, as shown in Figure 11.1.
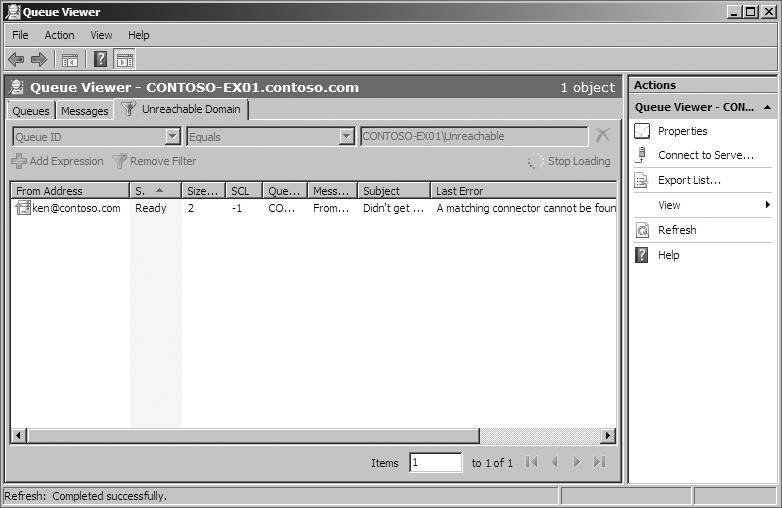
When the Queue Viewer is opened, the Submission queue is shown by default. Other queues that currently have messages in them will also appear. You can double-click on the queue to open it and view the details of the messages that are inside. Figure 11.2 shows a message stuck in the Unreachable queue because it couldn't find a Simple Mail Transfer Protocol (SMTP) connector to route the message over.
Figure 11.1: Opening the Queue Viewer tool from the EMC
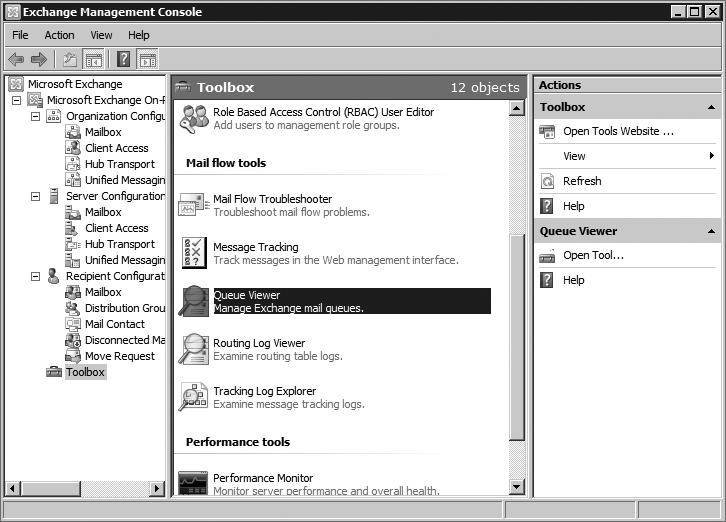
Figure 11.2: A message trapped in the Unreachable queue
There are a few different things you can do to messages that are stuck in a queue. Table 11.1 lists your options.
Table 11.1: Actions You Can Take on Queued Messages
| Suspend the message | Stops the message from being delivered and moved out of the queue | Does not apply to the Submission queue or the Poison Message queue. |
| Remove the message | Removes the message from the queue | You have the option of sending a nondelivery report to the sender or just silently dropping the message from the queue. This does not apply to the Submission queue. |
| Export the message | Makes a copy of the queued message without removing the message from the queue | Cannot be done in the Queue Viewer. Exporting messages can only be performed with the EMS. |
| Resubmit the message | Moves the message out of the queue and resubmits it to the Submission queue | Causes the message to go through categorization again. |
Suspend and Remove Messages from Queues
You can suspend and remove messages using the Queue Viewer. Use the following steps:
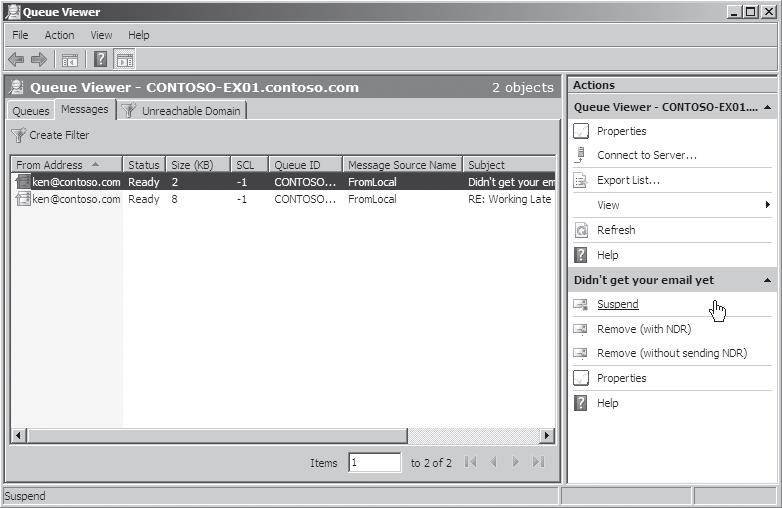
- In the Queue Viewer, select the Messages tab in the main pane. The messages that are currently in the queue are listed.
- Click on the message that you want to suspend or remove. The Actions pane on the right will present the options that you have (Figure 11.3). Remember that you cannot perform these options on messages that are in the Submission queue.
- Click Suspend to suspend the message. Click Remove (With NDR) to remove the message and send a nondelivery report to the sender. Click Remove (Without Sending NDR) to drop the message from the queue without notifying the sender. The sender may assume that the message was delivered.
- If you choose to remove a message, you are prompted for confirmation. Click the Yes button in the confirmation dialog box to continue.
Figure 11.3: Suspending or removing a message from a queue
Export a Message from the Queue Using the Exchange Management Shell
If you want to export a message from a queue, you must use the Exchange Management Shell. Run the Export-Message cmdlet to export the message. You will need to specify the message identity and the file path to where you want to export the message. To get the message identity, you can view the properties of the queued message in the Queue Viewer or you can run the Get-Message cmdlet. The following example retrieves the message identity for the messages that are in the Unreachable queue:
Get-Message -Queue CONTOSO-EX01 \Unreachable | ft Identity, ⇐ FromAddress, Status
For further instructions on using the Export-Message cmdlet, refer to Chapter 6, "Managing Message Routing."
Resubmit a Queued Message Using the Exchange Management Shell
When you resubmit a message, you must resubmit all the messages in the queue. To resubmit messages, you use the Retry-Queue cmdlet in the EMS and specify the Resubmit parameter. The following example resubmits all of the messages in the Unreachable queue:
Retry-Queue CONTOSO-EX01 \Unreachable -Resubmit $True
Use Protocol Logging to Diagnose Transport Problems
Protocol logging provides a method for you to determine what's happening behind the scenes in an SMTP exchange between servers. By turning on protocol logging, you can determine what the servers are saying to each other. Protocol logging can be enabled for send connectors or receive connectors. Send connectors and receive connectors maintain separate protocol logs.
To use protocol logging, follow these steps:
- Turn protocol logging on at the connector that you want to log.
- Determine or change the location of the protocol logs.
- Examine the logs and understand what they are saying.
Enable Protocol Logging on Receive Connectors
To use the EMC to turn on protocol logging for receive connectors on a Hub Transport server, follow these steps:
- Open the EMC and browse to the Server Configuration ⇒ Hub Transport node in the Console tree.
- Select the Hub Transport server that contains the receive connector from the list in the Results pane.
- In the list of receive connectors, select the connector that you want to enable protocol logging on and click the Properties action in the Actions pane.
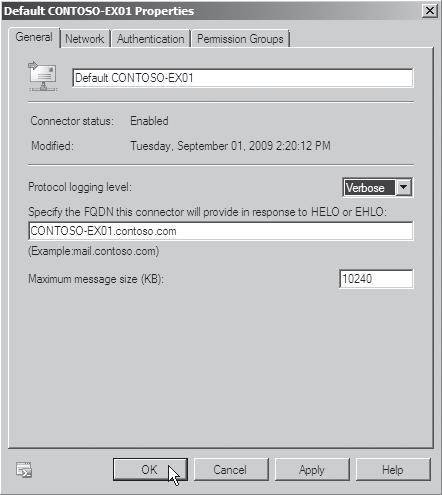
- In the properties dialog box for the connector, select the General tab.
- Next to the Protocol Logging Level option, select Verbose from the drop-down list, as shown in Figure 11.4.
- Click OK to make the changes and close the properties dialog box.
You can also enable protocol logging on a receive connector through the EMS. Use the following command to enable protocol logging:
Set-ReceiveConnector ReceiveConnectorName ⇐ -ProtocolLoggingLevel Verbose
Enable Protocol Logging on Send Connectors
To enable protocol logging on send connectors in the EMC, follow these steps:
- Open the EMC and browse to the Organization Configuration ⇒ Hub Transport node in the Console tree.
- Select the Send Connectors tab in the Work area.
- In the list of send connectors, select the connector that you want to enable protocol logging on.
- In the Actions pane on the right, click the Properties action to open the properties dialog box for the connector.
- In the properties dialog box, select the General tab.
- To the right of the Protocol Logging Level field, select Verbose from the drop-down list.
- Click OK to make the change and close the properties dialog box.
Figure 11.4: Enabling protocol logging on a receive connector
You can also enable the protocol logs for send connectors using the following EMS command:
Set-SendConnector SendConnectorName -ProtocolLoggingLevel ⇐ Verbose
Configure the Location of the Protocol Logs
When you enable protocol logging, information is written to the protocol logs. On each server there is one instance of these logs for send connectors and one instance for receive connectors. To determine where those logs are or to change the location of those logs, you can use the following steps in the EMC:
- Open the EMC and browse to the Server Configuration ⇒ Hub Transport node in the Console tree.
- In the list of Hub Transport servers in the Results pane, select the server that you want to modify the location of the protocol logs on.
- In the Actions pane on the right, select the Properties task to display the properties dialog box for the server you have selected.
- In the properties dialog box, click the Log Settings tab.
- View or modify the folder path in the Send Protocol Log Path field or the Receive Protocol Log Path field (Figure 11.5).
- If you changed any of the protocol log paths, click OK to make the changes and close the properties dialog box.
Figure 11.5: Viewing or modifying the folder path of the protocol logs

Read the Protocol Logs
After the protocol logs are configured, you can open the logs and start reading through them. Browse to the folder that the logs are stored in using the path that you discovered previously. You can simply doubleclick on the log to open it using Notepad.exe.
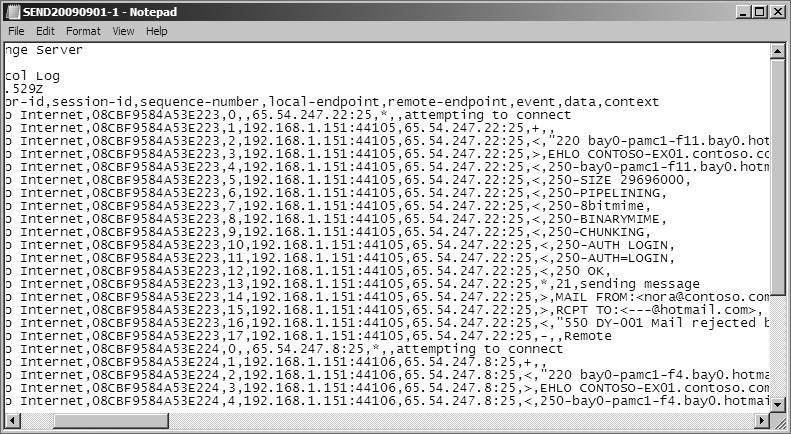
The protocol log records several parameters that you can use to determine why a message isn't being sent from or received by a particular server. The notable fields used by the protocol logs are detailed in Table 11.2.
Table 11.2: Fields Used by the Protocol Logs
| date-time | The date and time that the event occurred. |
| connector-id | The name of the connector that the event occurred on. |
| session-id | The unique ID associated with the SMTP session. You can use this to distinguish SMTP sessions from one another. |
| sequence-number | A number that is associated with each event in the current SMTP session. This is used to determine which order things happened in. |
| local-endpoint | The IP address and port used on your Exchange server. |
| remote-endpoint | The IP address and port used by the external Mail server. |
| Event | Indicates what was happening in the exchange. The session can be connected (+) or disconnected (-). After a session is connected, commands can be sent (>) or received (<). The log also indicates informational (*) messages. |
Using the information in the protocol logs, you can determine what exactly is happening during the SMTP session and take action accordingly. Figure 11.6 shows the send connector protocol logs from a message that was rejected by a server.
Track Message Flow
The ability to track message flow inside an Exchange organization is useful when you want to determine what has happened to a message after the user sent it. You can track message flow throughout an Exchange organization using the message tracking logs. The message tracking logs keep track of messages that are sent between transport servers and to and from mailbox servers. These logs can be enabled on Mailbox, Hub Transport, and Edge Transport servers. Message tracking logs are enabled by default, so unless you explicitly turned them off, you can just start analyzing them.
Figure 11.6: A sample protocol log from a send connector
You have a few options for viewing message logs:
- Viewing the log files directly
- Using the Tracking Log Explorer
- Using the Exchange Management Shell
View the Log Files Directly
Directly viewing the log files with a tool such as Notepad.exe might not be the most efficient method of viewing the logs, but it's available to you as an option. Determine where the logs are kept on the Transport server by running the following EMS command:
Get-TransportServer ServerName | fl MessageTrackingLogPath
To determine where the logs are on a Mailbox server, use this EMS command:
Get-MailboxServer ServerName | fl MessageTrackingLogPath
After you get the path of the logs, you can browse to the folder on your server. Log files on transport servers are given the name MSGTRKyyyymmdd-#.log and mailbox server message tracking log files are named MSGTRKMyyyymmdd-#.log. The identifier yyyymmddcorresponds to the year, month, and day that the log file was created. Each log file is given a number that increments for each log file created on that day. By default, after log files reach 10 MB, a new log file is created with an incremented number. If your server has the Hub Transport role and Mailbox role combined, you will see both the MSGTRK log and the MSGTRKM log in the folder. However, the tracking log files for the Transport server and Mailbox server are kept separate even if it's the same server.
If you open one of the message tracking log files in Notepad.exe, you will see a comma-separated file similar to the one shown in Figure 11.7.
Figure 11.7: Message tracking log file
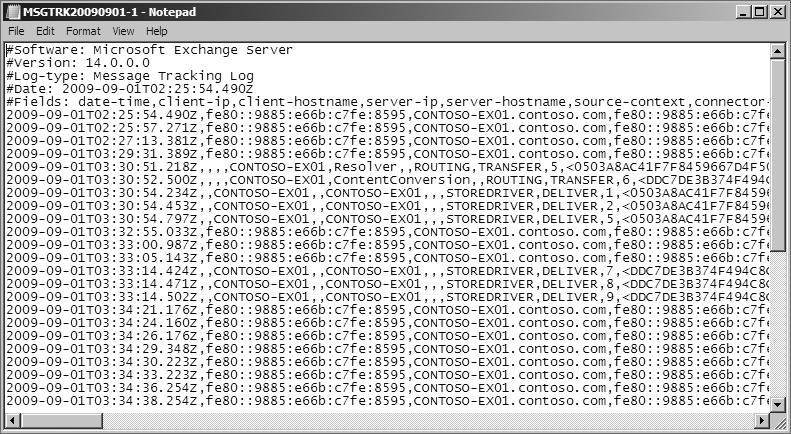
There are multiple fields in this file that indicate useful information such as the time that the message was sent or received, the servers that were involved in transporting the message, and the sender, recipient, and subject of the message. Although this information is available in the raw log files, using the Tracking Log Explorer to analyze the information may be a better choice.
Use the Tracking Log Explorer
The Tracking Log Explorer is part of the Exchange Troubleshooting Assistant, which is used in diagnosing multiple issues with Exchange.
You can use the Tracking Log Explorer to search through the message tracking logs and determine what exactly has happened to a message. As shown in Figure 11.8, there are multiple parameters you can perform the search with. If you don't specify the sender or the server, the search is performed against the Exchange server that you are currently logged in at.
Figure 11.8: Available search parameters in the Tracking Log Explorer
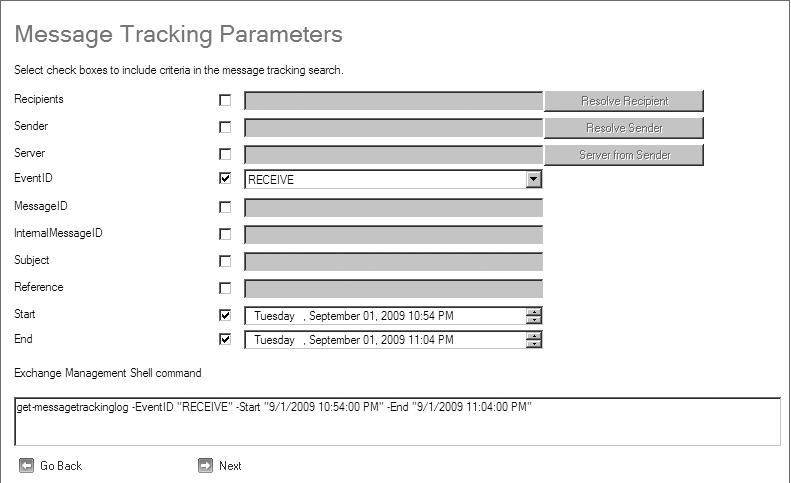
A field at the bottom of the parameters dialog box specifies the EMS parameter that is used in the search. You can copy and paste this command into the Exchange Management Shell to duplicate the results that the Tracking Log Explorer got.
The following steps demonstrate how to use the Tracking Log Explorer to track a message:
- Open the EMC and browse to the Toolbox node in the Console tree.
- In the Work area, double-click on the Tracking Log Explorer tool from the list of tools in the Mail Flow Tools section of the EMC. The Exchange Troubleshooting Assistant launches and goes straight to the Tracking Log Explorer. If this is your first time using the Tracking Log Explorer, you may see a welcome screen that you can safely bypass.
- In the Message Tracking Parameters dialog box, select the parameters that you want to use to perform the search. You can use the Sender, Recipients, or Subject fields to find the message that you want to track.
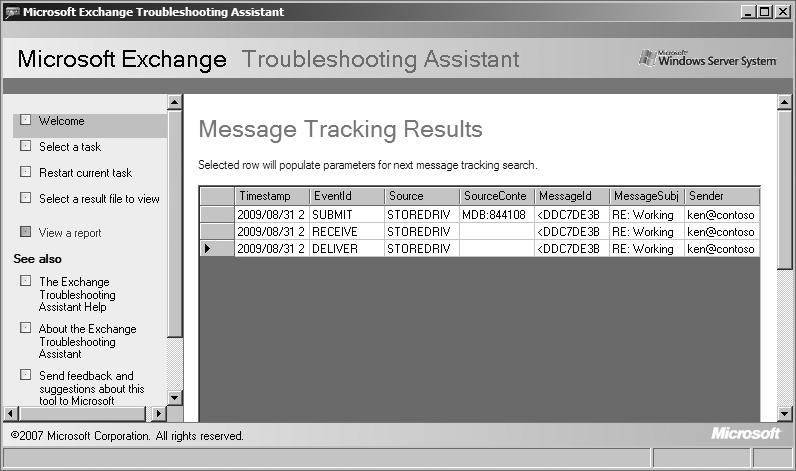
- Click Next to search for the message in the message tracking logs. The Message Tracking Results dialog box will display all the events that were found matching your search criteria. If you look at the results shown in Figure 11.9, you can see that the particular message that was searched on was submitted by the Mailbox server, received by the Transport server, and delivered to the recipient's mailbox.
Figure 11.9: Viewing the results of a tracked message
Track Messages in the EMS
You can use the Get-MessageTrackingLog cmdlet to perform various message tracking searches in the EMS. The easiest way to use the EMS for searching through message tracking logs is to build the search using the Tracking Log Explorer and then copy and modify the EMS command that the tool creates for you.
For example, the EMS command that was used by the Tracking Log Explorer in the previous example can be run directly in the EMS:
Get-MessageTrackingLog -Server CONTOSO-EX01 ⇐ -MessageSubject "RE: Working Late"
Subscribe to:
Posts (Atom)