IT Dashboard
Posted by rjivan on March 28, 2011 at 2:21pm
The IT Dashboard is a management tool for the United States federal government CIOs to use in overseeing their IT spending. To support transparency and open government initiatives, Federal decision makers also chose to make the IT Dashboard available to the general public. In the IT Dashboard, members of the public can view the same data about performance that government officials use.
Background
In June 2009, Federal IT leaders asked two questions about their IT budgets. These questions are common in the commercial world, but have been difficult to answer in the public sector:- Where are our IT dollars going?
- Are we getting value from our investments?
Purpose of the IT Dashboard
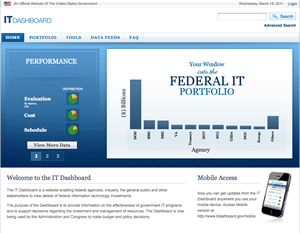
The IT Dashboard provides full lifecycle performance information on IT projects' scope and status. The data allows users to see project status, spot problems and trends, manage performance and quality expectations, and establish accountability. The tool is useful to the public and to government IT leaders who plan and manage IT investments. The home page screen shown above gives an overview of the tool.IT Dashboard’s value comes from several facets:
- Mashing-up data from multiple data sets (IT project justification, schedule/status, expenditures, contractors.)
- Ensuring that real-time and complete data is available.
- Presenting the data and comparisons in ways that are visual and easy to drill into.
- Providing only high-level data that doesn't overwhelm the viewer.
Site Design and Functionality
Originally conceived as a PHP application, the IT Dashboard evolved to a Drupal-based application, employing the Drupal API, several modules, and basic theming. While not all functionality is built in a customary Drupal way, we have modified all pages so that they can be accessed using menu hooks. The advantage of using such hooks is that now all those pages can use the Drupal API, and contributed modules, without worrying about whether or not Drupal has been properly bootstrapped.
One of the primary requirements was that REI Systems deploy the IT Dashboard rapidly. Since the source datasets were already available, developers avoided the need for a data migration step by working with the existing data model. With a working data model and Drupal’s easy-to-use components, we went to initial release in under six weeks. Since the launch in 2009 active development has been ongoing.
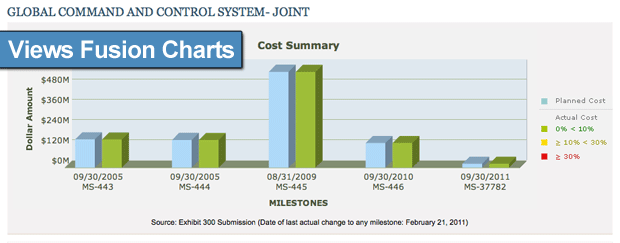
Another requirement was that the IT Dashboard incorporate captivating and practical data visualizations. To meet these requirements several visualization libraries are used across the site. FusionCharts drives most of the bar, pie and line graphs throughout the site. Google Motion Charts and JuiceKit power the more advanced Tools section of the site.
Initial plan was for agencies to enter monthly updates through data entry screens. However, this approach quickly led to delays and data quality issues. To address these issues, we introduced an XML API, allowing for system-to-system integration between the IT Dashboard and the systems used by more than 26 Federal agencies.
Access authentication for data providers is handled by integrating with an existing security system, included within the OMB's MAX system -- the tool used by federal agencies to enter and report official budgetary data. This integration was accomplished by extending the Drupal Central Authentication Services module (CAS), which controls role-based data access at both the application and database levels. The application makes certain data visible to the user only if they have appropriate permissions; otherwise, the user is limited to viewing only the publicly available data and graphics. User credentials are propagated to the database and are stored in a database session. This information is used by the Database Views module to enforce authentication and authorization rules.
The use of the FusionCharts library, which uses the Adobe Flash plug-in for rendering, meant that many mobile users were not able to easily access the same information as desktop users. To address the growing need for mobile use, a mobile-friendly version of the website was rolled out using the jqTouch library and the javascript visualization library flot.
Apache SOLR powers the search capability. A private SOLR index is used for authenticated users and a public SOLR index with a subset of the data is used for anonymous users.
Infrastructure
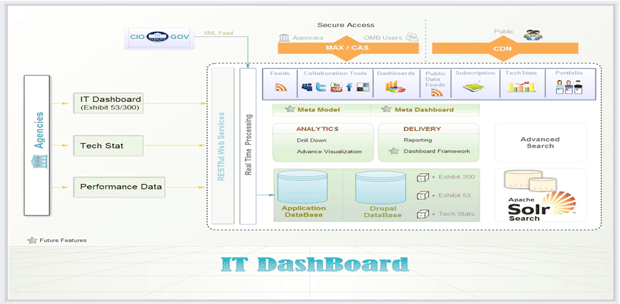
To support easy scalability and accessibility, the IT Dashboard resides in the cloud.The federal government selected a technical environment that is robust; provides Infrastructure as a Service (IaaS); offers high levels of security, scalability, reliability and accessibility; and has a security plan and existing capabilities to protect publicly accessible web sites that disclose government information.
The IT Dashboard leverages a Content Delivery Network (CDN) structure for the public portion of the website to improve overall system performance. Business data is stored in a separate MySQL database; the Drupal database contains only Drupal-specific configuration information, along with static content.
The infrastructure was selected to support a tool open to use by more than 26 government agencies, members of Congress, the IT vendor community, and the general public - whomever may have some interest in the federal government IT investments.
Module Use
Contributed ModulesMajor modules that were used were:
- CAS - Integrates with existing OMB CAS implementation named MAX.
- CCK - Used for data entry and file uploads.
- ClamAV - Scan attachments for viruses.
- Context - Used for page layout.
- Skinr - Allows easy application of a pre-built style library to blocks.
- ThemeKey - Eases transition from old theme to new theme on per page basis.
- Views 3 - Allowed us to plug in our own query backend, necessary to access separate application database.
The following custom modules were developed for the IT Dashboard:
- Data Controller - A Views 3 Datasource plugin that has support for aggregations and efficient query generation.
- PHP Dataset - Describe data sets for views using custom PHP code. We are using this to drive views that require data from the application database.
- Views FusionCharts - Display style plugin to render view output as a FusionChart. This module is compatible with Views 2 and 3.
Challenges and Lessons Learned
We learned one significant lesson through this effort, namely that Drupal APIs were more versatile than we had originally believed. Our work on the IT Dashboard started initially with a PHP application, not using any Drupal APIs. We found several problems with this approach, each of which make system maintenance more complex and error-prone:- The logic in SQL queries tended not to be re-used.
- Security items need to be addressed separately for each page viewed.
- There was not clear separation between logic and presentation.
- Centralize the logic of most queries in View Default.
- Establish a clean separation between View logic and View display.
- Most SQL-injection and XSS issues are already addressed in the code of the contributed modules.
-
Reconciling preferences of different stakeholders for
different visualization and layouts in order to take advantage of
Drupal's strength in a consistent presentation style.
Drupal offers many ways to utilize templates and generic modules to implement a consistent look and feel across many screens. However the quick turnaround and occasionally conflicting preferences from different stakeholders made it difficult to develop an overall design that leveraged this Drupal strength. We have made a number of revisions since launch to improve consistency and we plan to address this challenge by spending more time up-front on mock-ups, and facilitating agreement across stakeholders on the end-state vision.
-
Legacy system includes a data model that isn't suited to new uses.
The IT Dashboard has a separate application database that originated from a previous system. We addressed the challenge of accessing this database by using a custom query plugin for the Views 3 module.
-
Facilitating expansion/collapse of table data detail to suit user preferences (an example of custom display functionality).
Many IT Dashboard screens have custom functionality, which could not be satisfied by the Views module at a basic level. For example, some screens offer a table view of data. However, the desire not to overwhelm all users with the full set of data led to a decision that some rows should offer an "expand" button to allow drill-down capability at the user's option. Implementing this customized functionality required custom coding.
Project Team
The site is currently operated by a nine member team, composed of the following roles:- 4 Drupal developers
- 1 database developer
- 1 QA engineer
- 2 business analyst
- 1 project manager