Translate

Showing posts with label exchange. Show all posts

Sunday, September 15, 2013

Mail Flow dalam Exchange 2013

Mail Flow

21 out of 25 rated this helpful Rate this topic
 
Applies to: Exchange Server 2013
Topic Last Modified: 2013-03-28
In Microsoft Exchange Server 2013, mail flow occurs through the transport pipeline. The transport pipeline is a collection of services, connections, components, and queues that work together to route all messages to the categorizer in the Transport service on a Mailbox server inside the organization.
Looking for a list of all mail flow topics? See Mail flow documentation.
For information about how to configure mail flow in a new Exchange 2013 organization, see Configure Mail Flow and Client Access.
Contents
The transport pipeline consists of the following services:
  • Front End Transport service   This service runs on all Client Access servers and acts as a stateless proxy for all inbound and outbound external SMTP traffic for the Exchange 2013 organization. The Front End Transport service doesn't inspect message content, only communicates with the Transport service on a Mailbox server, and doesn't queue any messages locally.
  • Transport service   This service runs on all Mailbox servers and is virtually identical to the Hub Transport server role in previous versions of Exchange. The Transport service handles all SMTP mail flow for the organization, performs message categorization, and performs message content inspection. Unlike previous versions of Exchange, the Transport service never communicates directly with mailbox databases. That task is now handled by the Mailbox Transport service. The Transport service routes messages between the Mailbox Transport service, the Transport service, and the Front End Transport service.
  • Mailbox Transport service   This service runs on all Mailbox servers and consists of two separate services: the Mailbox Transport Submission service and Mailbox Transport Delivery service. The Mailbox Transport Delivery service receives SMTP messages from the Transport service on the local Mailbox server or on other Mailbox servers, and connects to the local mailbox database using an Exchange remote procedure call (RPC) to deliver the message. The Mailbox Transport Submission service connects to the local mailbox database using RPC to retrieve messages, and submits the messages over SMTP to the Transport service on the local Mailbox server, or on other Mailbox servers. The Mailbox Transport Submission service has access to the same routing topology information as the Transport service. Like the Front End Transport service, the Mailbox Transport service also doesn't queue any messages locally.
Messages from outside the organization enter the transport pipeline through a Receive connector in the Front End Transport service on a Client Access server and are then routed to the Transport service on a Mailbox server.
Messages inside the organization enter the Transport service on a Mailbox server in one of the following ways:
  • Through a Receive connector.
  • From the Pickup directory or the Replay directory.
  • From the Mailbox Transport service.
  • Through agent submission.
noteNote:
If you have an Exchange 2010 or Exchange 2007 Edge Transport server in your perimeter network, Internet mail flow occurs directly between the Transport service on the Mailbox server and the Edge Transport server. For more information, see Use an Edge Transport Server in Exchange 2013.
The following figure shows the relationships among the components in the Exchange 2013 transport pipeline.
Transport pipeline overview diagram
Every message that's sent or received in an Exchange 2013 organization must be categorized in the Transport service on a Mailbox server before it can be routed and delivered. After a message has been categorized, it's put in a delivery queue for delivery to the destination mailbox database, the destination database availability group (DAG), Active Directory site, or Active Directory forest, or to the destination domain outside the organization.
The Transport service on a Mailbox server consists of the following components and processes:
  • SMTP Receive   When messages are received by the Transport service, message content inspection is performed, transport rules are applied, and anti-spam and anti-malware inspection is performed if they are enabled. The SMTP session has a series of events that work together in a specific order to validate the contents of a message before it's accepted. After a message has passed completely through SMTP Receive and isn't rejected by receive events, or by an anti-spam and anti-malware agent, it's put in the Submission queue.
  • Submission   Submission is the process of putting messages into the Submission queue. The categorizer picks up one message at a time for categorization. Submission happens in three ways:
    • Through an SMTP Receive connector.
    • Through the Pickup directory or the Replay directory. These directories exist on the Mailbox server. Correctly formatted message files that are copied into the Pickup directory or the Replay directory are put directly into the Submission queue.
    • Through a transport agent.
  • Categorizer   The categorizer picks up one message at a time from the Submission queue. The categorizer completes the following steps:
    • Recipient resolution, which includes top-level addressing, expansion, and bifurcation.
    • Routing resolution.
    • Content conversion.
    Additionally, mail flow rules that are defined by the organization are applied. After messages have been categorized, they're put into a delivery queue that's based on the destination of the message. Messages are queued by the destination mailbox database, DAG, Active Directory site, Active Directory forest or external domain.
  • SMTP Send   How messages are routed from the Transport service depends on the location of the message recipients relative to the Mailbox server where categorization occurred. The message could be routed to the Mailbox Transport service on the same Mailbox server, the Mailbox Transport service on a different Mailbox server that's part of the same DAG, the Transport service on a Mailbox server in a different DAG, Active Directory site, or Active Directory forest, or to the Front End Transport service on a Client Access server for delivery to the Internet.
The following table contains links to topics that will help you learn about and manage mail flow in Exchange 2013.


TopicDescription
Mail routing describes how messages are transmitted between messaging servers.
Connectors define where and how messages are transmitted to and from Exchange servers.
Accepted domains define the SMTP address spaces that are used in the Exchange organization. Remote domains configure message formatting and encoding settings for messages sent to external domains.
Transport agents act on messages as they travel through the Exchange transport pipeline.
Transport high availability describes how Exchange 2013 keeps redundant copies of messages during transit and after delivery.
Transport logs record what happens to messages as they flow through the transport pipeline.
Moderated transport requires approval for messages sent to specific recipients.
Content conversion controls the Transport Neutral encoding format (TNEF) message conversion options for external recipients, and the MAPI conversion options for internal recipients.
Delivery status notifications (DSNs) are the system messages that are sent to message senders, for example, non-delivery reports (NDRs).
Delivery Reports is a message tracking tool that you can use to search for delivery status on email messages sent to or from users in your organization's address book, with a certain subject. You can track delivery information about messages sent by or received from any specific mailbox in your organization.
This topic describes the size and individual component limits that are imposed on messages.
You use the Queue Viewer in the Exchange Toolbox to view and act upon queues and message in queues.
The pickup and replay directories are used to insert message files into the transport pipeline.
This topic describes the considerations for using an Edge Transport server from previous versions of Exchange in Exchange 2013.

Message tracking tools dlm Exchange Server 2010 dgn EMS


Exchange Management Shell, Queue Viewer: Message tracking tools

Solution providers' takeaway: Monitoring the health of Exchange Server 2010 requires you to know how to use Exchange Management Shell and Queue Viewer to track messages and determine if there are mail flow issues in the server.
When your Exchange servers are healthy and performing well, there is a much smaller chance of problems surfacing that you didn't anticipate. This chapter is about being proactive. That is, actively seeking out potential issues before they happen. In order to be proactive, we'll look primarily in two areas. The first area is ensuring that your Exchange servers are healthy. I'll show you how to make sure that mail is flowing freely throughout your transport servers. I'll also show you how to proactively verify your health by monitoring your logs and other factors. We'll also take a look at the Exchange Best Practices Analyzer, and use that helpful tool to make sure that your Exchange implementation is in line with best practices.
The second area that we'll look at is the performance of Exchange. There are many methods and tools that can be used to evaluate the performance of your Exchange servers. I'll show you how to use the most common tools and methods that you'll want to use in your environment as a minimum.
Keep Exchange Healthy
The Exchange administrator has no bigger task than to ensure that the system stays up and running. Unfortunately, many administrators are forced to live in reactive mode, constantly putting out the biggest fire. Instead, administrators should strive to be consistently in proactive mode. When you are in a state of proactivity, you don't need to "react" to events, but instead you "respond" to them. In other words, living in proactive mode means that you'll smell the smoke before the fire starts. You'll detect little issues and quirks ahead of time so you can correct them before they become big problems.
There are a few key areas that you need to become proactive in if you want to be effective in keeping your Exchange implementation healthy:
  • Keeping messages moving in and out of the Exchange Organization
  • Ensuring that your Exchange servers aren't standing on their last leg
  • Using best practices in your implementation
This section shows you what you can do to proactively monitor the health of Exchange in these areas.
Ensure That Mail Flows Freely
Ensuring that mail can be routed successfully throughout your environment is an important area to look at when you are monitoring Exchange health. A routing problem may not be easy to detect until it has compounded for a while. This is one of those areas where you can't depend on your users to notify you if there's a problem. If mail delivery is delayed, users may not even call the help desk because they may just blame it on the "slow network." And when messages are routed outside the organization, there are so many factors outside your control that you may not even realize the problem is with your servers.
Now more than ever, it's important to pay careful attention to your routing topology because Exchange relies heavily on an external dependency—Active Directory. Exchange administrators may not be aware of site topology changes in Active Directory (AD), and this can greatly affect how mail is routed.
Check Message Queues
When messages can't be routed to the next hop toward their destination, they will be held in one of the queues on the transport server that can't route the message. If users are sending mail and the messages are taking a long time to reach their recipients, there may be an excessive amount of messages in a queue. Therefore, it's important to monitor your queues and ensure that no issues exist that might prevent message delivery.
The two primary tools for checking message queues in Exchange Server 2010 are the Queue Viewer and the Exchange Management Shell (EMS). The Queue Viewer is accessible through the Toolbox portion of the Exchange Management Console (EMC). To open the Queue Viewer, follow these steps:
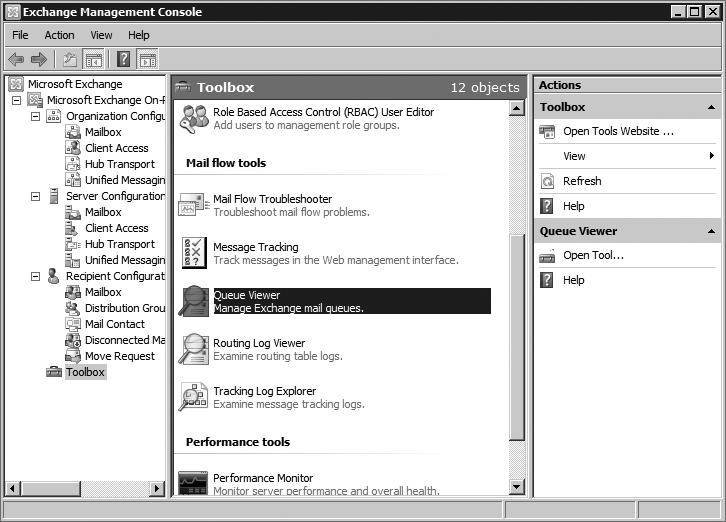
  1. Open the EMC and browse to the Toolbox node in the Console tree. The Work area will list several tools that are included in Exchange Server 2010.
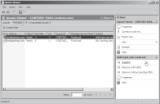
  2. In the Mail Flow Tools section, double-click the Queue Viewer tool, as shown in Figure 11.1.
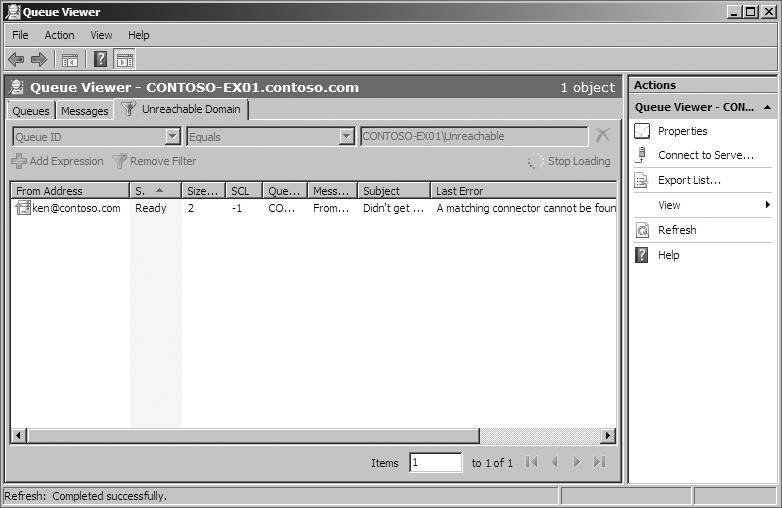
When the Queue Viewer is opened, the Submission queue is shown by default. Other queues that currently have messages in them will also appear. You can double-click on the queue to open it and view the details of the messages that are inside. Figure 11.2 shows a message stuck in the Unreachable queue because it couldn't find a Simple Mail Transfer Protocol (SMTP) connector to route the message over.
Figure 11.1: Opening the Queue Viewer tool from the EMC
Figure 11.2: A message trapped in the Unreachable queue
There are a few different things you can do to messages that are stuck in a queue. Table 11.1 lists your options.
Table 11.1: Actions You Can Take on Queued Messages
ActionDescriptionUsage Notes
Suspend the messageStops the message from being delivered and moved out of the queueDoes not apply to the Submission queue or the Poison Message queue.
Remove the messageRemoves the message from the queueYou have the option of sending a nondelivery report to the sender or just silently dropping the message from the queue. This does not apply to the Submission queue.
Export the messageMakes a copy of the queued message without removing the message from the queueCannot be done in the Queue Viewer. Exporting messages can only be performed with the EMS.
Resubmit the messageMoves the message out of the queue and resubmits it to the Submission queueCauses the message to go through categorization again.
Suspend and Remove Messages from Queues
You can suspend and remove messages using the Queue Viewer. Use the following steps:
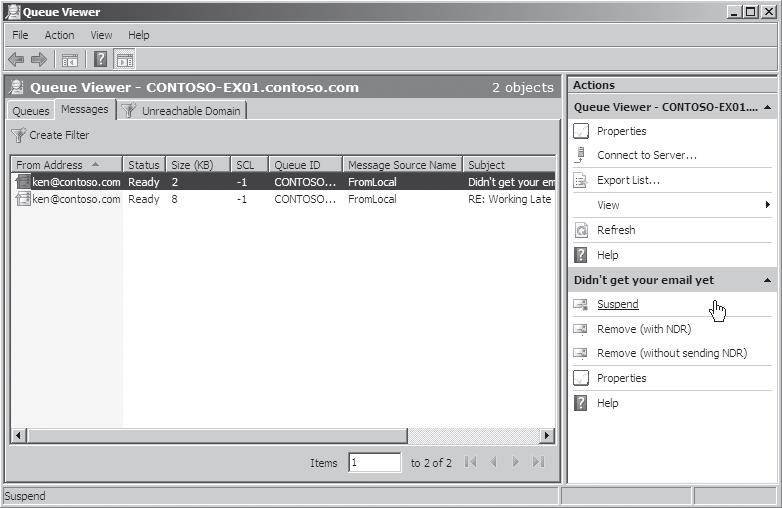
  1. In the Queue Viewer, select the Messages tab in the main pane. The messages that are currently in the queue are listed.
  2. Click on the message that you want to suspend or remove. The Actions pane on the right will present the options that you have (Figure 11.3). Remember that you cannot perform these options on messages that are in the Submission queue.
  3. Click Suspend to suspend the message. Click Remove (With NDR) to remove the message and send a nondelivery report to the sender. Click Remove (Without Sending NDR) to drop the message from the queue without notifying the sender. The sender may assume that the message was delivered.
  4. If you choose to remove a message, you are prompted for confirmation. Click the Yes button in the confirmation dialog box to continue.
Figure 11.3: Suspending or removing a message from a queue
Export a Message from the Queue Using the Exchange Management Shell
If you want to export a message from a queue, you must use the Exchange Management Shell. Run the Export-Message cmdlet to export the message. You will need to specify the message identity and the file path to where you want to export the message. To get the message identity, you can view the properties of the queued message in the Queue Viewer or you can run the Get-Message cmdlet. The following example retrieves the message identity for the messages that are in the Unreachable queue:
Get-Message -Queue CONTOSO-EX01 \Unreachable | ft Identity, ⇐ FromAddress, Status
For further instructions on using the Export-Message cmdlet, refer to Chapter 6, "Managing Message Routing."
Resubmit a Queued Message Using the Exchange Management Shell
When you resubmit a message, you must resubmit all the messages in the queue. To resubmit messages, you use the Retry-Queue cmdlet in the EMS and specify the Resubmit parameter. The following example resubmits all of the messages in the Unreachable queue:
Retry-Queue CONTOSO-EX01 \Unreachable -Resubmit $True
Use Protocol Logging to Diagnose Transport Problems
Protocol logging provides a method for you to determine what's happening behind the scenes in an SMTP exchange between servers. By turning on protocol logging, you can determine what the servers are saying to each other. Protocol logging can be enabled for send connectors or receive connectors. Send connectors and receive connectors maintain separate protocol logs.
To use protocol logging, follow these steps:
  1. Turn protocol logging on at the connector that you want to log.
  2. Determine or change the location of the protocol logs.
  3. Examine the logs and understand what they are saying.
Enable Protocol Logging on Receive Connectors
To use the EMC to turn on protocol logging for receive connectors on a Hub Transport server, follow these steps:
  1. Open the EMC and browse to the Server Configuration ⇒ Hub Transport node in the Console tree.
  2. Select the Hub Transport server that contains the receive connector from the list in the Results pane.
  3. In the list of receive connectors, select the connector that you want to enable protocol logging on and click the Properties action in the Actions pane.
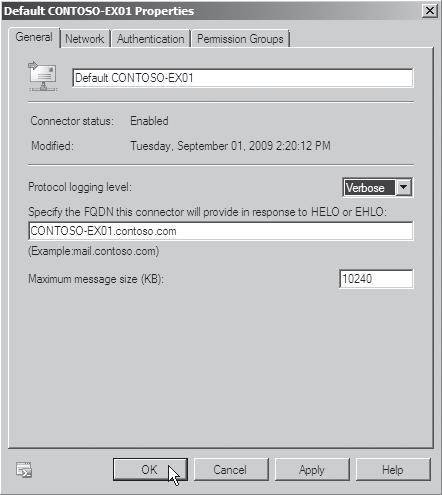
  4. In the properties dialog box for the connector, select the General tab.
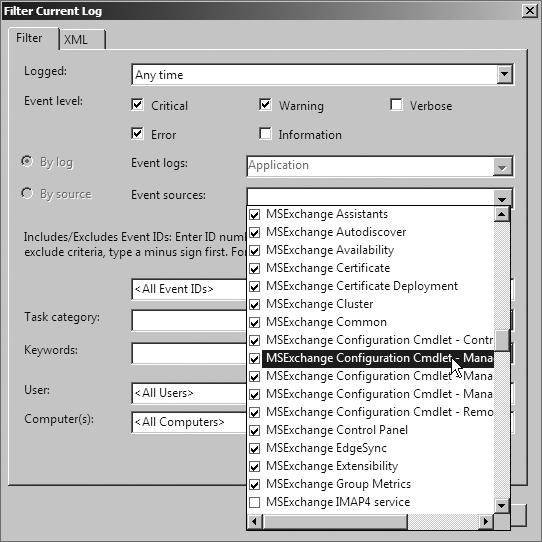
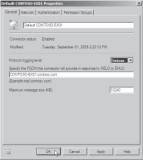
  5. Next to the Protocol Logging Level option, select Verbose from the drop-down list, as shown in Figure 11.4.
  6. Click OK to make the changes and close the properties dialog box.
You can also enable protocol logging on a receive connector through the EMS. Use the following command to enable protocol logging:
Set-ReceiveConnector ReceiveConnectorName ⇐ -ProtocolLoggingLevel Verbose
Enable Protocol Logging on Send Connectors
To enable protocol logging on send connectors in the EMC, follow these steps:
  1. Open the EMC and browse to the Organization Configuration ⇒ Hub Transport node in the Console tree.
  2. Select the Send Connectors tab in the Work area.
  3. In the list of send connectors, select the connector that you want to enable protocol logging on.
  4. In the Actions pane on the right, click the Properties action to open the properties dialog box for the connector.
  5. In the properties dialog box, select the General tab.
  6. To the right of the Protocol Logging Level field, select Verbose from the drop-down list.
  7. Click OK to make the change and close the properties dialog box.
Figure 11.4: Enabling protocol logging on a receive connector
You can also enable the protocol logs for send connectors using the following EMS command:
Set-SendConnector SendConnectorName -ProtocolLoggingLevel ⇐ Verbose
Configure the Location of the Protocol Logs
When you enable protocol logging, information is written to the protocol logs. On each server there is one instance of these logs for send connectors and one instance for receive connectors. To determine where those logs are or to change the location of those logs, you can use the following steps in the EMC:
  1. Open the EMC and browse to the Server Configuration ⇒ Hub Transport node in the Console tree.
  2. In the list of Hub Transport servers in the Results pane, select the server that you want to modify the location of the protocol logs on.
  3. In the Actions pane on the right, select the Properties task to display the properties dialog box for the server you have selected.
  4. In the properties dialog box, click the Log Settings tab.
  5. View or modify the folder path in the Send Protocol Log Path field or the Receive Protocol Log Path field (Figure 11.5).
  6. If you changed any of the protocol log paths, click OK to make the changes and close the properties dialog box.
Figure 11.5: Viewing or modifying the folder path of the protocol logs
Read the Protocol Logs
After the protocol logs are configured, you can open the logs and start reading through them. Browse to the folder that the logs are stored in using the path that you discovered previously. You can simply doubleclick on the log to open it using Notepad.exe.
The protocol log records several parameters that you can use to determine why a message isn't being sent from or received by a particular server. The notable fields used by the protocol logs are detailed in Table 11.2.
Table 11.2: Fields Used by the Protocol Logs
Field NameDescription
date-timeThe date and time that the event occurred.
connector-idThe name of the connector that the event occurred on.
session-idThe unique ID associated with the SMTP session. You can use this to distinguish SMTP sessions from one another.
sequence-numberA number that is associated with each event in the current SMTP session. This is used to determine which order things happened in.
local-endpointThe IP address and port used on your Exchange server.
remote-endpointThe IP address and port used by the external Mail server.
EventIndicates what was happening in the exchange. The session can be connected (+) or disconnected (-). After a session is connected, commands can be sent (>) or received (<). The log also indicates informational (*) messages.
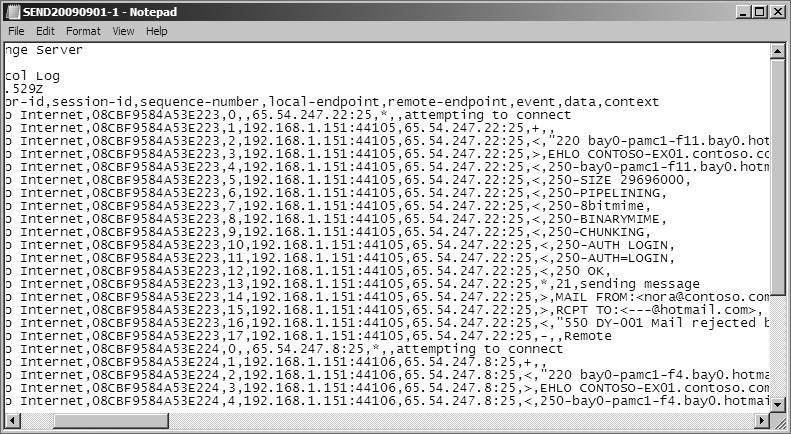
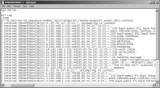
Using the information in the protocol logs, you can determine what exactly is happening during the SMTP session and take action accordingly. Figure 11.6 shows the send connector protocol logs from a message that was rejected by a server.
Track Message Flow
The ability to track message flow inside an Exchange organization is useful when you want to determine what has happened to a message after the user sent it. You can track message flow throughout an Exchange organization using the message tracking logs. The message tracking logs keep track of messages that are sent between transport servers and to and from mailbox servers. These logs can be enabled on Mailbox, Hub Transport, and Edge Transport servers. Message tracking logs are enabled by default, so unless you explicitly turned them off, you can just start analyzing them.
Figure 11.6: A sample protocol log from a send connector
You have a few options for viewing message logs:
  • Viewing the log files directly
  • Using the Tracking Log Explorer
  • Using the Exchange Management Shell
View the Log Files Directly
Directly viewing the log files with a tool such as Notepad.exe might not be the most efficient method of viewing the logs, but it's available to you as an option. Determine where the logs are kept on the Transport server by running the following EMS command:
Get-TransportServer ServerName | fl MessageTrackingLogPath
To determine where the logs are on a Mailbox server, use this EMS command:
Get-MailboxServer ServerName | fl MessageTrackingLogPath
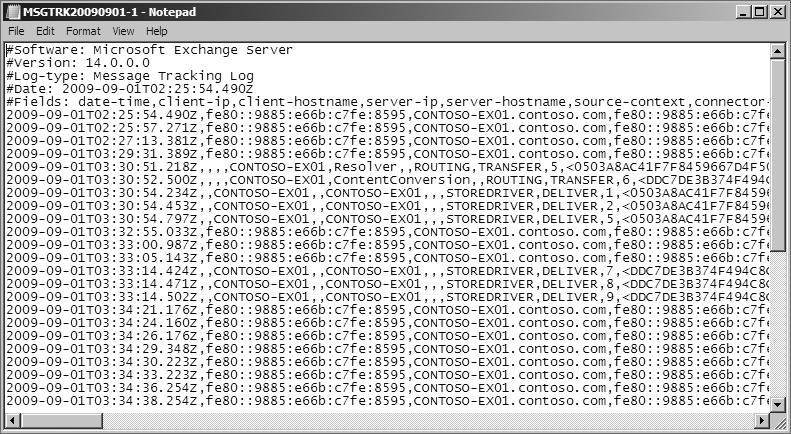
After you get the path of the logs, you can browse to the folder on your server. Log files on transport servers are given the name MSGTRKyyyymmdd-#.log and mailbox server message tracking log files are named MSGTRKMyyyymmdd-#.log. The identifier yyyymmddcorresponds to the year, month, and day that the log file was created. Each log file is given a number that increments for each log file created on that day. By default, after log files reach 10 MB, a new log file is created with an incremented number. If your server has the Hub Transport role and Mailbox role combined, you will see both the MSGTRK log and the MSGTRKM log in the folder. However, the tracking log files for the Transport server and Mailbox server are kept separate even if it's the same server.
If you open one of the message tracking log files in Notepad.exe, you will see a comma-separated file similar to the one shown in Figure 11.7.
Figure 11.7: Message tracking log file
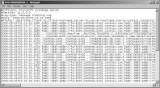
There are multiple fields in this file that indicate useful information such as the time that the message was sent or received, the servers that were involved in transporting the message, and the sender, recipient, and subject of the message. Although this information is available in the raw log files, using the Tracking Log Explorer to analyze the information may be a better choice.
Use the Tracking Log Explorer
The Tracking Log Explorer is part of the Exchange Troubleshooting Assistant, which is used in diagnosing multiple issues with Exchange.
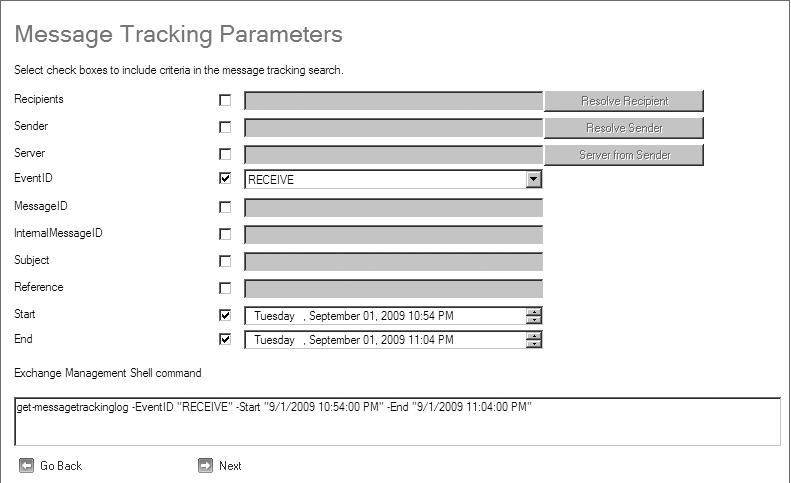
You can use the Tracking Log Explorer to search through the message tracking logs and determine what exactly has happened to a message. As shown in Figure 11.8, there are multiple parameters you can perform the search with. If you don't specify the sender or the server, the search is performed against the Exchange server that you are currently logged in at.
Figure 11.8: Available search parameters in the Tracking Log Explorer
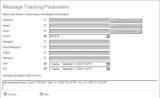
A field at the bottom of the parameters dialog box specifies the EMS parameter that is used in the search. You can copy and paste this command into the Exchange Management Shell to duplicate the results that the Tracking Log Explorer got.
The following steps demonstrate how to use the Tracking Log Explorer to track a message:
  1. Open the EMC and browse to the Toolbox node in the Console tree.
  2. In the Work area, double-click on the Tracking Log Explorer tool from the list of tools in the Mail Flow Tools section of the EMC. The Exchange Troubleshooting Assistant launches and goes straight to the Tracking Log Explorer. If this is your first time using the Tracking Log Explorer, you may see a welcome screen that you can safely bypass.
  3. In the Message Tracking Parameters dialog box, select the parameters that you want to use to perform the search. You can use the Sender, Recipients, or Subject fields to find the message that you want to track.
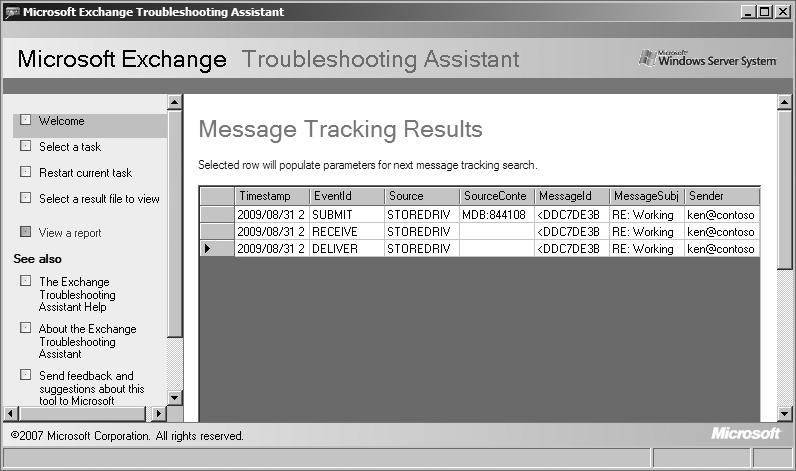
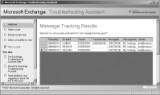
  4. Click Next to search for the message in the message tracking logs. The Message Tracking Results dialog box will display all the events that were found matching your search criteria. If you look at the results shown in Figure 11.9, you can see that the particular message that was searched on was submitted by the Mailbox server, received by the Transport server, and delivered to the recipient's mailbox.
Figure 11.9: Viewing the results of a tracked message
Track Messages in the EMS
You can use the Get-MessageTrackingLog cmdlet to perform various message tracking searches in the EMS. The easiest way to use the EMS for searching through message tracking logs is to build the search using the Tracking Log Explorer and then copy and modify the EMS command that the tool creates for you.
For example, the EMS command that was used by the Tracking Log Explorer in the previous example can be run directly in the EMS:
Get-MessageTrackingLog -Server CONTOSO-EX01 ⇐ -MessageSubject "RE: Working Late"

Monitoring Exchange Server 2010 dgn ExBPA


Monitoring Exchange Server 2010 : Using event logs, ExBPA

Solution provider's takeaway: Being proactive about the health of Exchange Server 2010 will make life easier when trying to solve any issues for customers down the road. Performing tasks such as event log monitoring or using the Exchange Best Practices Analyzer (ExBPA) tool will be vital to keeping Exchange Server 2010 healthy.
Verify Exchange Server Health
A large part of being proactive in managing your Exchange environment is knowing where your servers stand in terms of health. This section discusses various things that you need to keep an eye on to help ensure that your servers are healthy.
Monitor the Event Logs
Event logs in Windows are used by several components and applications as a place to record critical alerts and notifications that may be of interest to system administrators. Exchange Server 2010 also uses the Windows event logs to record important events. Exchange records most of its events to the Application log, but you may also see some events recorded elsewhere. However, the majority of the events that you need to be concerned about for Exchange will appear in the Application log.
As a part of your responsibilities as an Exchange Server 2010 administrator, it's vital to check the event logs on each Exchange server and make sure that you don't see any undetected problems or other events that could become big issues in the future. You will primarily want to keep an eye out for any Warning or Error events, as they indicate problems that the server is currently having or could have.
View Relevant Events
To view the Application event log, follow these steps:

  1. Click Start ⇒ Administrative Tools ⇒ Event Viewer. This launches the Event Viewer application that is built into Windows.
  2. In the Event Viewer Console tree, browse to the Windows Logs ⇒ Application node.
    The event logs for Exchange (and other processes) are displayed in the Results pane. You can search through the log line by line or you can create a filter.
  3. If you want to filter out everything except for the Exchange logs, click the Filter Current Log task in the Actions pane on the right.
  4. In the Filter Current Log dialog box, select the Critical, Error, and Warning check boxes. These events will indicate that something is wrong with Exchange or that something may soon break.
  5. While still in the Filter Current Log dialog box, click on the drop-down list for the Event Sources field and select the relevant events that begin with MSExchange from the list, as shown in Figure 11.10. Click OK when finished.
  6. Figure 11.10: Filtering out everything except for the Exchange logs in Event Viewer
  7. Back in the Event Viewer dialog box, you can now view only the events relevant to Exchange.
Specify the Level of Logging Detail
If you find that you need more detail than what is provided in the Application logs, you can turn the dial up on what Exchange logs in the Application log. To increase logging, use the Set-EventLogLevel cmdlet in the EMS. You will need to specify the category of logs that you want to increase and how much you want to increase it.
In the following example, we will check and change the log level for the MSExchangeRPC log:

  1. To determine what component to enable higher logging on and to determine the current logging level, run the following command:
    Get-EventLogLevel

  2. The Get-EventLogLevel command displays information about each component. Use the built-in PowerShell filtering capabilities to narrow down this list to display only event log categories that have the characters rpc in the identity:
    Get-EventLogLevel *rpc*

  3. To specify a logging level of High for the MSExchangeRPC log, use the following command:
    Set-EventLogLevel "MSExchangeSA \RPC Calls" -Level High
Monitor Disk Space on Database and Log Drives
The amount of free disk space is an important thing to monitor, particularly on your volumes that contain the database files or the transaction log files. On Mailbox servers, when the volume that contains the database gets full the database will be dismounted, which prevents users from accessing their mailboxes on that database. Dismounting the database is how Exchange protects the integrity of the data, as it cannot write additional data to the database if there is no space to do so. The database is dismounted when there is 2 MB of disk space left on the volume.
When the database is dismounted due to the disk being full, Exchange will log an event in the Application log with event ID 1003, as shown in Figure 11.11.
Figure 11.11: Event ID 1003 is logged when the database volume is out of free space.
Before the database can be mounted again, you must free up some space on the volume. There are multiple ways to reclaim space:

  • Back up the server and allow the transaction logs to truncate.
  • Back up the server and permanently delete any mailboxes that may be stored in deleted mailbox retention.
  • Perform an offline defragmentation of the database using the ESEUTIL /D command. This may take some time to complete.
  • If you're using a SAN-based volume, you can grow the size of the LUN that is presented to the Exchange server.
  • Back up any extraneous data or personal files and delete them or move them to a more appropriate server.
  • Move any transaction logs that have already been committed to another volume.
On Transport servers, when the disk that contains the message queue database and logs nears capacity, Exchange applies back pressure, which instructs Exchange to stop accepting new connections and potentially stops all message flow. By default, the Transport servers require at least 500 MB of disk space free on the volumes that contain the queue database and logs, so you should monitor the free disk space on those locations.
If you get into the situation of being low on disk space on your Transport server and back pressure is being applied, alleviate the problem using one of the following methods:

  • Free up disk space on the Transport server by removing extraneous data.
  • Move the queue database and logs to a separate volume with more space available.
  • Modify the threshold numbers used to determine when to apply back pressure.
When back pressure is applied or relinquished, the Transport servers will log events in the Application log with event IDs of 15004 and 15005. You can monitor the Application log for these events on your Transport servers to indicate that back pressure is being applied.
Ensure That Services Are Running
The various components of Exchange run as services in Windows. Not all of the services need to be running in order for Exchange to be functional, however. Certain services may only need to be started if Exchange is using a feature that relies on services, such as POP or IMAP. In fact, one of the best practices in hardening servers is to disable services that you are not required to run.
There are core services that need to be running in Exchange in order for an Exchange server in a particular role to function correctly. You should monitor these services to ensure that they are running. Many problems are attributable to a service that has stopped running for one reason or another. If you know when a critical service stops, you can respond rapidly to get the problem resolved.
Table 11.3 lists the services that Exchange Server 2010 uses and identifies which services are critical for each role.
Table 11.3: Critical Services That Need to Remain Running for Each Role

ServiceMailboxClient AccessHub TransportEdge Transport
IIS Admin ServiceYesYesYesNo
Microsoft Exchange Active Directory TopologyYesYesYesNo
IIS Admin ServiceYesYesYesNo
Microsoft Exchange ADAMNoNoNoYes
Microsoft Exchange Credential ServiceNoNoNoYes
Microsoft Exchange EdgeSyncNoNoYesNo
Microsoft Exchange Information StoreYesNoNoNo
Microsoft Exchange Mailbox AssistantsYesNoNoNo
Microsoft Exchange Address BookNoYesNoNo
Microsoft Exchange Forms-Based Authentication ServiceNoYesNoNo
Microsoft Exchange File DistributionNoYesNoNo
Microsoft Exchange Mail SubmissionYesNoNoNo
Microsoft Exchange Mailbox ReplicationYesYesNoNo
Microsoft Exchange Protected Service HostNoYesNoNo
Microsoft Exchange RPC Client AccessYesYesNoNo
Microsoft Exchange System AttendantYesNoNoNo
Microsoft Exchange Search IndexerYesNoNoNo
Microsoft Exchange Service HostYesYesYesYes
Microsoft Exchange ThrottlingYesNoNoNo
Microsoft Exchange TransportNoNoYesYes
Microsoft Exchange Transport Log SearchYesNoYesNo
World Wide Web Publishing ServiceYesYesYesNo
Windows Remote ManagementYesYesYesNo
To determine if the required services for each role are running, you can execute the Test-ServiceHealth cmdlet in the EMS. You do not need to include any parameters.
The Test-ServiceHealth cmdlet will return the list of roles that are running on the Exchange server along with a list of the services for those roles. The cmdlet identifies the services that are running as well as the services that are not running but should be.
The following output demonstrates what is returned by the command when the Mail Submission service is stopped on a Mailbox server:

Role : Mailbox Server Role RequiredServicesRunning : False ServicesRunning : {IISAdmin, MSExchangeADTopology, MSExchangeIS, MSExchangeMailbox Assistants, MSExchangeRepl, MSEx changeRPC, MSExchangeSA, MSExchange Search, MSExchangeServiceHost, MS ExchangeThrottling, MSExchange TransportLogSearch, W3Svc, WinRM} ServicesNotRunning : {MSExchangeMailSubmission} 
Use the Test Cmdlets in the Exchange Management Shell
Exchange Server 2010 provides several cmdlets in the Exchange Management Shell that are focused on testing the functionality and configuration of Exchange. The list of test cmdlets has grown in comparison to those available with Exchange Server 2007, and there are several useful ones that can make your job as an Exchange administrator a lot easier. Table 11.4 describes the available test cmdlets. You may have seen some of these cmdlets used throughout this book when working with certain aspects of Exchange.
Table 11.4: The Test-* Cmdlets in Exchange Server 2010

CmdletDescription
Test-ActiveSyncConnectivityTests mobile device connectivity through ActiveSync. The cmdlet attempts to synchronize the mobile device that you specify in the command.
Test-EcpConnectivityTests access to the Exchange Control Panel on a Client Access server that you specify.
Test-EdgeSynchronizationTests the synchronization of Edge Transport servers.
Test-FederationTrustTests the configuration of the federation trust with the Microsoft Federation Gateway.
Test-FederationTrustCertificateTests the certificate used for your federation trust.
Test-ImapConnectivityTests the connectivity of one or more IMAP clients.
Test-IPAllowListProviderTests mobile device connectivity through ActiveSync. The cmdlet attempts to synchronize the mobile device that you specify in the command.
Test-IPBlockListProviderTests that the configured IP block list provider is available and checks an IP address against it.
Test-IRMConfigurationTests the configuration of Rights Management in Exchange.
Test-MailflowTests whether mail can be sent to and from mailbox servers in the Exchange organization.
Test-MapiConnectivityTests that a mailbox can be logged into. If run against a database, it tests that the system mailbox for the database can be logged into.
Test-MessageSubmits a test message to the specified recipients. This can be used to test transport rules and have a report generated about the tests.
Test-MRSHealthTests to ensure that the Mailbox Replication Service is running properly.
Test-OutlookConnectivityThoroughly tests the connectivity of Outlook by testing profile creation, AutoDiscover, and mailbox access.
Test-OutlookWebServicesTests that AutoDiscover is returning the correct configuration information for a user and tests each of the service endpoints returned by AutoDiscover.
Test-OwaConnectivityTests that Outlook Web App can be contacted and successfully logged into.
Test-PopConnectivityTests the connectivity of one or more POP clients.
Test-PowerShellConnectivityTests that PowerShell can be used remotely and can successfully issue commands.
Test-ReplicationHealthTests multiple aspects of replication for a server in a DAG.
Test-SenderIdTests sender ID checking against an IP address and domain that you specify.
Test-ServiceHealthTests that the services for each Exchange role installed are running.
Test-SystemHealthTests the overall health of the Exchange server through multiple tests.
Test-WebServicesConnectivityTests the functionality of Exchange Web Services through the use of Outlook Anywhere.
Tip:
The test cmdlets don't need to always be run on demand. You can choose a few of them that you want to run on a regular basis and create scheduled tasks out of them. For information on creating scheduled tasks from PowerShell scripts, refer to Chapter 2, "Using the Exchange Management Console and the Exchange Management Shell."
When running some of these test cmdlets, you may be required to have a specific test account created beforehand. To create this account, use the following steps:

  1. Open the EMS and browse to the Scripts folder in the location where Exchange is installed. By default, this location is C: \Program Files \Microsoft \Exchange Server \v14 \Scripts.
  2. Run the PS1 script called New-TestCasConnectivityUser.ps1.
  3. When prompted for a password, type a temporary password and press Enter. This password is just used for the creation of the test account and you will therefore not need to remember this password.
  4. When prompted to continue creating the test user, press Enter. The test user is automatically created. When the test account is finished, the script will end and you will be returned to the EMS command prompt.
Use the Exchange Best Practices Analyzer
The Exchange Best Practices Analyzer (ExBPA) is a powerful tool in the Exchange administrator's toolbox that should be run on a regular basis. The ExBPA can perform a variety of tests that help ensure the health of your Exchange organization. In this section, I will show you how to run a health check.
The ExBPA health check component performs a variety of tests against your Exchange servers and presents the results in an easy-toread report. When reviewing the report, you will be presented with the critical issues encountered and given the opportunity to read more about why the issue was detected and how to correct it.
To perform a health check with the ExBPA, use the following steps:

  1. Open the Exchange Best Practices Analyzer. You can do this by opening the EMC and browsing to the Toolbox node in the Console tree. Under the Configuration Management Tools portion of the Toolbox, double-click on Best Practices Analyzer.
  2. If this is the first time you are running the BPA, you will be presented with a welcome screen. Decide whether you want to join the Microsoft Customer Experience Improvement Program and then click Go To The Welcome Screen.
  3. At the Welcome screen, select the option Select Options For A New Scan.
  4. On the Connect To Active Directory screen, type the name of the domain controller you want to connect to and click Connect To The Active Directory Server.
  5. If you want to use different credentials than what you are currently logged in as for communication with Active Directory, click Show Advanced Login Options and enter the credentials that you want to use.
  6. Your connectivity and access permissions are verified before continuing.
  7. On the Start A New Best Practices Scan screen, enter a name for the scan and select Health Check from the list of scans to perform.
  8. If you only want to scan specific Exchange servers, you can select those servers from the Specify The Scope For This Scan list.
  9. After you configured your options, click Start Scanning, as shown in Figure 11.12.
  10. Figure 11.12: Configuring the BPA to perform a health check
    On the Scanning In Progress screen, the scan is performed. The amount of time that the scan takes to complete will vary depending on how many servers you are scanning and the speed of your network.
  11. After the scan completes, you will be taken to the Scanning Complete screen. Select the option View A Report Of This Best Practices Scan.
  12. View the results of the scan and take any necessary action on reported issues by selecting the option Tell Me More About This Setting, as you can see in Figure 11.13.